
How to Use TradingView on Deriv: A Step-by-Step Guide
Integrate TradingView's advanced charts on Deriv easily 🖥️. Step-by-step setup, customisation tips, and solutions for a smoother trading experience on this popular Kenyan platform.
Edited By
Daniel Hughes
TradingView has become a popular platform among Kenyan traders, investors, and financial analysts for market analysis. Its blend of powerful charting tools, real-time data, and customisable options makes it a go-to choice for those wanting to sharpen their trading decisions.
At its core, TradingView offers seamless integration with various financial instruments such as equities on the Nairobi Securities Exchange (NSE), forex pairs, commodities, and cryptocurrencies. This versatility allows users to track multiple asset classes without switching platforms.
Setting up TradingView is straightforward. After creating an account, you can link your data provider or brokerage to access live market feeds. For Kenyan traders, connecting with platforms offering NSE data or forex rates is essential for accurate analysis.
One standout feature is chart customisation. You can pick from different chart types like candlesticks, bars, or lines, and apply indicators such as Moving Averages, Relative Strength Index (RSI), and Bollinger Bands. For example, a trader monitoring KCB Bank shares might add a 50-day moving average to spot trends alongside volume indicators to confirm market moves.
Tip: Save your chart layouts to avoid repeating setup processes each time you log in.
Beyond visuals, TradingView supports Pine Script, its scripting language for creating custom indicators and alerts. Pine Script enables analysts to automate repetitive tasks, such as signalling when Safaricom shares breach a certain price level or triggering notifications based on technical patterns. This hands-on approach can sharpen timing for entry or exit points.
However, some challenges arise during implementation. Data lags can occur, especially with free accounts limiting access to premium NSE feeds. Network issues and browser compatibility also affect performance, so it helps to maintain a stable internet connection and update browsers regularly.
By integrating TradingView judiciously—using its charting flexibility, scripting capabilities, and relevant data streams—you can enhance your market outlook and trade with more confidence. This platform bridges data and decision-making effectively, a vital mix for thriving in Kenya’s dynamic financial markets.
Getting started with TradingView lays the foundation for effective market analysis. This phase familiarises you with the platform’s tools and features, which are key for making informed trading decisions in both Kenyan and global markets. Whether you are a trader, analyst, or entrepreneur, knowing how to set up and navigate TradingView can save time and improve your market insights.
Setting up a TradingView profile is straightforward yet vital. Signing up only requires an email or social media account, after which you personalise your profile to save chart layouts, alerts, and watchlists. By organising your account early, you avoid repeatedly setting configurations, allowing you to focus on analysing stocks, forex, and commodities relevant to Kenyan markets like NSE-listed companies or forex pairs involving KES.
Overview of key interface elements helps you understand how to use the platform efficiently. The main screen includes the chart window, left toolbar (for drawing tools), right sidebar (market data and alerts), and bottom panel (trade history and ideas). Familiarity with these elements means you can quickly access indicators or place your preferred chart types. For example, you might set a candlestick chart with RSI and moving averages readily visible for quick analysis during market hours.
Understanding free vs premium features lets you choose what suits your trading style and budget. The free plan includes all basic chart types, popular indicators, and delayed data, which suffices for casual traders or beginners. Premium subscriptions unlock features like multiple charts on one screen, real-time data, extended alert options, and more complex Pine Script capabilities. Kenyan traders dealing with real-time NSE data or margin trading with brokers may find premium plans worthwhile to gain timely insights.
Linking to live market data feeds is essential for accuracy in real-time trading decisions. TradingView supports global exchanges and various data providers; however, some feeds require extra subscription fees on top of your TradingView plan. For Kenyan users, it’s important to verify if the Nairobi Securities Exchange (NSE) feed is included or needs separate access. Having real-time or near real-time data reduces risks of acting on outdated prices.
Integrating with supported brokerage services allows you to execute trades directly from TradingView’s platform, streamlining your workflow. A few brokers compatible with TradingView offer order placement and portfolio tracking through the interface. While local Kenyan brokers might have limited integration now, international brokers servicing Kenyan clients often do. This setup helps in placing timely trades without switching between multiple platforms.
Kenyan market data availability currently varies. NSE data may come with delays if not on premium plans or direct subscriptions. Additionally, some Kenyan stocks have lower liquidity, so the data might look different compared to highly liquid markets like US equities. Understanding this helps traders set realistic expectations and complement TradingView data with local sources like broker platforms or KRA updates when necessary.
Getting familiar with TradingView’s setup and data connections prepares you to analyse markets confidently and act without being slowed by technical hurdles.
By starting smart with TradingView, you position yourself to experience smoother, more effective trading suited to Kenyan market realities and global opportunities alike.
Customising charts is key when analysing both Kenyan and global markets because it helps traders and investors see data in ways that suit their specific trading styles and objectives. Every market has its unique rhythm and behaviour; for instance, Nairobi Securities Exchange (NSE) stocks may respond differently compared to forex markets or commodities. Adjusting charts with the right tools and indicators ensures you focus on what matters most and avoid getting lost in unnecessary noise.
Candlestick charts are the go-to for many traders because they provide a clear picture of price action in each period, showing open, high, low, and close prices. They make spotting trends, reversals, and market sentiment easier. For example, when analysing Safaricom's stock (NSE: SCOM), candlesticks help highlight buying pressure during market openings or selling pressure near closures.
Line charts, on the other hand, connect closing prices over time to give a simple visual of price trends. They are useful for beginners or when you want to focus on general direction without too many distractions. Bar charts are somewhat similar to candlesticks but use vertical lines to denote price ranges, offering another way to visualise market volatility.
Time frames influence how you interpret market movements. Day traders often work on 5-minute or 15-minute charts to capture quick price changes, which is valuable during NSE active sessions or forex market volatility. Swing traders might prefer daily or 4-hour charts to catch medium-term trends.
Long-term investors usually focus on weekly or monthly charts to understand broader shifts – such as economic cycles affecting Kenyan staples like KCB Bank (NSE: KCB). Choosing the correct time frame aligns your analysis with your goals, whether that’s quick profit from short-term swings or steady growth over months.
Technical indicators add depth to chart analysis by providing insights beyond price alone. Common choices on TradingView include the Moving Average (MA) to track price trends, the Relative Strength Index (RSI) to spot overbought or oversold conditions, and Bollinger Bands to assess price volatility.
For Kenyan stocks like Equity Bank (NSE: EQTY), combining the 50-day and 200-day moving averages can reveal important trend changes. In forex markets, such as USD/KES currency pairs, RSI helps identify potential entry and exit points during rapid price shifts influenced by local or global news.
Drawing tools are essential for marking trendlines, support, and resistance levels clearly on charts. Drawing a trendline along the lows or highs of Safaricom’s share price, for instance, highlights the direction of the market and potential rebound points.
Support lines help identify where prices typically find buying interest — a key for timing entries. Resistance lines show where selling pressure might cap price increases. These tools enable you spot setups like breakouts or pullbacks, which are vital for making informed trades in both NSE stocks and wider forex or commodity markets.
Effective use of customised charts, indicators, and drawing tools allows you to read market action more clearly, improving timing and confidence in your trading decisions.
Automating market analysis with Pine Script on TradingView offers Kenyan traders a significant advantage. It allows you to create customised alerts and indicators that react instantly to market movements, saving time and improving decision-making. Instead of repeatedly scanning charts, you can programme automated signals that highlight key price actions or technical setups in real time.
Writing simple scripts for alerts and signals is an excellent starting point. For example, you could write a script to notify you when the price of Safaricom shares crosses a moving average, indicating a possible trend change. This automation frees you from constant monitoring and helps capture opportunities promptly. Simple alert scripts can also notify you if RSI (Relative Strength Index) enters overbought or oversold zones in forex pairs like USD/KES.
Understanding common functions and syntax helps turn these ideas into actionable scripts. Pine Script is designed to be easy for beginners; it includes functions like close for the latest price, sma() for simple moving averages, and logical operators (>, ``) to structure your conditions. For instance, plot(sma(close,14)) would draw a 14-day moving average on your chart. These basic elements combine to form more complex strategies.
Kenyan markets have unique characteristics, and Pine Script lets you develop custom indicators tailored for these local markets. For example, a trader might create an indicator that combines daily price volatility with liquidity measures from the NSE to identify stocks with breakout potential. This could be especially useful since Kenyan markets can experience sudden price shifts due to local economic news.
Another powerful feature is backtesting trading strategies using Pine Script. You can code specific rules—say, buying East African Breweries shares when the 50-day moving average crosses above the 200-day—and test how this strategy would have performed historically. Backtesting gives you confidence whether a strategy works before risking real money. It reveals strengths and weaknesses, adapting your approach to Kenya’s market rhythms.
Automating analysis through Pine Script not only boosts efficiency but also helps Kenyan traders capture market patterns they might otherwise miss, making it a practical tool for serious investors and brokers alike.
With Pine Script, you shift from reactive to proactive trading — an essential edge in Kenya’s lively financial scene.
When integrating TradingView into your market analysis routine, facing challenges is almost inevitable. These hurdles can affect your ability to make timely and accurate decisions, especially in the fast-moving world of trading. Understanding how to manage data issues and connectivity problems is vital. It ensures that Kenyan traders, investors, and financial analysts get the most from this powerful platform without interruptions hindering their workflow.
Data latency refers to the delay between when market prices update in the actual market and when you see those changes on TradingView. This delay can happen due to several reasons—exchange feed delays, internet speed, or the platform’s own processing time. For Kenyan traders following NSE stocks or forex pairs, even a few seconds of latency can influence entry or exit points, especially for day trading or scalping strategies.
Latency is more noticeable during high-volatility moments, such as after economic announcements or during heavy market activity. If you depend on real-time data for quick decisions, a delay could mean losing an opportunity or, worse, suffering an avoidable loss.
Getting the most accurate data involves a few practical steps. First, upgrade within TradingView to a premium plan if possible; this often includes access to the fastest and most direct market feeds. Second, connect directly to your brokerage’s live data feed if supported, as these tend to be more reliable than generic feeds.
Third, ensure your internet connection is stable and fast—preferably fibre or 4G LTE rather than congested mobile networks. Lastly, clear your browser cache regularly and keep TradingView updated to avoid software glitches that could delay data display. By doing so, you minimise discrepancies and improve your chart’s reliability.
Connectivity challenges are common in Kenya due to network fluctuations, especially outside major urban centres like Nairobi or Mombasa. Interruptions, slow speeds, or unstable networks can cause TradingView to freeze, fail to update charts, or even lose connection altogether. Power outages also add to the problem, often disrupting your trading session.
Besides internet reliability, device limitations such as older smartphones or computers can affect performance, causing the platform to lag or crash under heavy data loads.
To maintain steady access, consider these steps: Use a reliable internet provider, preferably one with a fibre optic connection. For mobile traders, a strong 4G or 5G signal with a data bundle tailored to high use helps maintain speed and stability. It’s wise to have a backup connection, such as a mobile hotspot, in case your main internet goes down.
Moreover, TradingView has mobile and desktop apps which often perform better than the web platform on certain devices. Keep your device’s software up to date and close unnecessary apps to free up memory. Lastly, consider accessing TradingView during off-peak internet hours if your connection struggles during the day.
Addressing these common challenges gives you an edge by ensuring your market analysis data is current and accessible whenever you need it. Stability and accuracy in information mean better trading decisions and a higher chance of success in Kenya’s fast-moving markets.
TradingView offers Kenyan traders an accessible yet powerful toolkit to make smarter market decisions. For many here, from casual investors to seasoned brokers, maximising these benefits means tapping into the platform’s collaborative features and integration possibilities. This ensures not only timely market insights but also smoother execution of trades tailored to local market dynamics. Whether tracking NSE equities or forex pairs, leveraging TradingView fully can sharpen your edge.
TradingView hosts a broad community where traders share scripts, strategies, and market views openly. These public scripts range from simple moving averages to complex algorithmic strategies, freely available for adaptation. For Kenyan traders, exploring this library can unveil approaches suited to local market behaviour—something that textbooks might miss.
For instance, a community script might combine RSI with volume spikes to detect momentum in Safaricom’s stock. You can test such scripts against NSE data or Kenyan forex pairs and adjust parameters to reflect typical trading volumes or market hours here. This shared knowledge acts like a local harambee, helping ideas grow collectively.
Adapting community tools involves tweaking general scripts to suit the specifics of Kenyan markets. Many public strategies use global market timings or asset classes unfamiliar locally. By adjusting time zones, currency pairs, or even incorporating Kenyan holidays into trading calendars, your indicators become more relevant and reliable.
For example, a Pine Script designed for the NYSE may not factor in local NSE trading breaks or market holidays. Adapting it to pause signals during such periods prevents false alerts. This practical tweak can save money and frustration when timing entry and exit points.
In Kenya, seamless integration between TradingView and existing tools enhances efficiency. Combining TradingView alerts with broker platforms streamlines trade execution. For example, you might receive buy or sell signals on TradingView and execute orders directly through your broker’s platform like KCB Securities or Sterling Capital. This removes unnecessary delays that could lead to missed opportunities.
M-Pesa, as the dominant mobile payment platform, can also fit into workflows, particularly for funding broker accounts swiftly. Some brokers allow deposit via Lipa Na M-Pesa directly, enabling you to capitalise on TradingView alerts quickly without banking bottlenecks. This is especially useful during volatile market movements when timing is critical.
Using TradingView alerts alongside mobile notifications lets you stay on top of market changes even while away from your desktop. Alerts for price movements or indicator crossovers can push directly to your phone via email, SMS, or app notification. This immediate info flow means you won’t miss trading chances due to poor internet or being stuck in transit on a matatu.
Integrations between TradingView, brokers, and mobile payment systems make Kenyan trading more responsive and accessible, vital in a fast-moving market.
By tapping into community-shared scripts and syncing TradingView with local tools like M-Pesa and Kenyan broker platforms, traders gain both insight and action speed. This blend is key to staying competitive in Kenya’s evolving financial markets.
Integrate TradingView's advanced charts on Deriv easily 🖥️. Step-by-step setup, customisation tips, and solutions for a smoother trading experience on this popular Kenyan platform.
📊 Master TradingView charts to analyse forex, stocks, and cryptocurrencies. Learn to customise, use indicators, and make savvy trades tailored for Kenyan market needs.
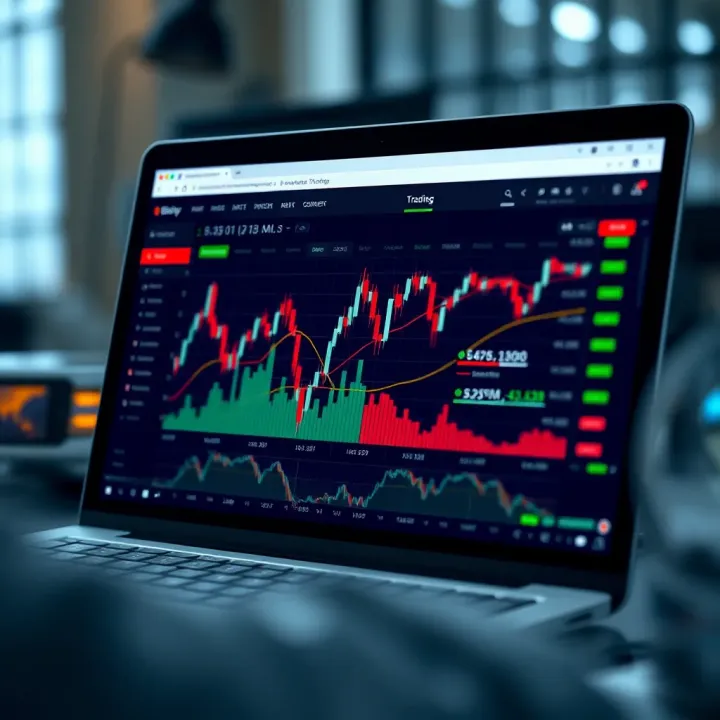
📈 Learn how Kenyan traders can combine TradingView with Deriv to sharpen decisions, manage risks effectively, and trade smartly within local regulations. 🇰🇪
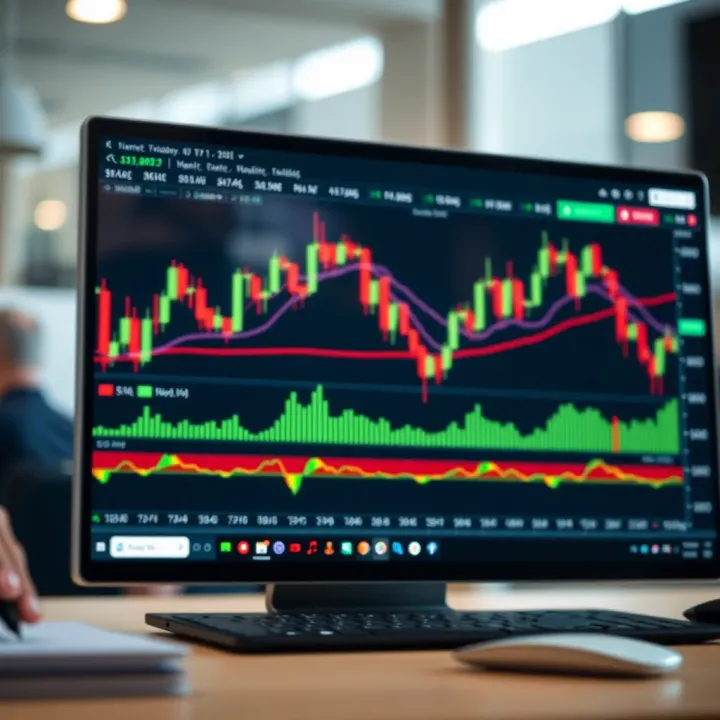
📈 Learn how Kenyan traders can use TradingView.com for real-time charting, market analysis, crypto tracking, and connecting with fellow investors. Trade smarter!
Based on 7 reviews