
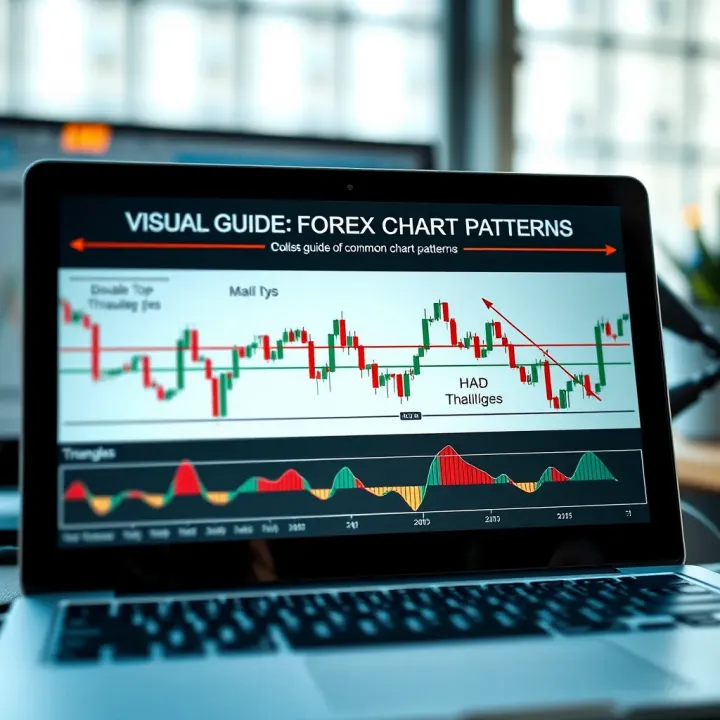
Forex Chart Patterns Explained with PDF Guides
📈 Learn to spot key forex chart patterns, interpret market moves, and boost your trading skills. Access practical tips plus PDF guides for easy study! 📊
Edited By
Oliver Scott
Understanding forex chart patterns is a key skill for anyone serious about trading currencies. These patterns provide clues on market direction, helping traders make informed decisions rather than relying on guesswork or hearsay. In Kenya, where access to affordable learning materials can be limited, free PDF resources offer a valuable way to sharpen your skills without stretching your budget.
Forex chart patterns are shapes formed by price movements on a trading chart. They signal possible market moves ahead, such as reversals or continuations of a trend. Spotting patterns like Head and Shoulders, Double Tops and Bottoms, or Triangles can guide you on when to enter or exit the market.

Recognising these patterns early can save you from costly mistakes and boost your confidence when trading the forex market.
For example, the Head and Shoulders pattern often indicates a trend reversal. If you see this pattern forming on the USD/KES chart, it might hint the currency pair is about to change direction. Identifying it correctly helps avoid holding a losing position.
Several free PDFs on forex chart patterns are available online, typically offered by forex brokers and trading education platforms. These guides explain pattern shapes visually, walk you through interpretation steps, and sometimes include quizzes or exercises for practice. You can download and study them at your own pace, even offline.
When choosing free PDF resources, look for those that:
Are up-to-date with current market practices
Use clear, easy-to-understand language
Include real-life examples relevant to forex pairs traded in Kenya, like USD/KES, EUR/USD, or GBP/USD
Also, practising pattern recognition alongside Kenya's popular trading platforms like MetaTrader 4 or TradingView helps embed knowledge practically.
In summary, forex chart patterns act as a map that shows where the market might head next. Using free PDFs to learn these patterns can make trading less of a gamble and more systematic. Whether you're a beginner or an experienced trader looking to refresh your skills, well-chosen educational materials make all the difference.
Understanding forex chart patterns is fundamental for any trader aiming to navigate the foreign exchange market confidently. These patterns reflect the collective behaviour of market participants, revealing supply and demand dynamics that can hint at future price movements. For Kenyan traders and investors, knowing how to read these patterns offers a practical edge in both short-term trading and longer-term investment strategies.
Forex chart patterns are distinct formations created by the price movements of currency pairs on a chart. They emerge as price traces highs, lows, and consolidations over time, visually outlining potential trends or reversals. Common examples include the Head and Shoulders, Triangles, and Flag patterns. For instance, a Head and Shoulders pattern might signal that the prevailing upward trend is about to reverse, enabling a trader to prepare for a potential fall in the currency value.
These patterns are not just random shapes; they result from traders' collective psychology — where fear, greed, and market news influence buying and selling decisions. Recognising these formations helps traders anticipate where the market might head next and plan their trades accordingly.
Chart patterns matter because they provide a strategic tool for decision-making without relying solely on complex indicators or guesswork. For example, if a trader spots a Double Top pattern in the USD/KES pair, it suggests that the currency has hit a resistance level twice and might soon decline. This insight can prompt timely actions like exiting a long position or setting stop-loss orders to protect capital.
Moreover, chart patterns work well alongside other analysis methods, such as volume tracking or fundamental factors like economic reports from CBK (Central Bank of Kenya) or US Federal Reserve announcements. They give a visual summary of market sentiment, helping traders avoid knee-jerk reactions to daily price noise.
Mastering chart patterns strengthens your ability to read the market’s intentions, enhancing timing and risk management in forex trading.
In practical terms, understanding chart patterns means you can spot better entry and exit points, manage risk wisely, and avoid common trading pitfalls. This foundation is especially useful in Kenya’s bustling trading scene, where access to online platforms and tools like free PDF guides can improve your technical skills without heavy costs.
Understanding common forex chart patterns helps traders react wisely to market moves. Recognising these shapes on price charts can signal changes in trend direction or continuation, which is key to making profitable decisions. These patterns don't guarantee outcomes but improve the chances of spotting when buyers or sellers are gaining control.
The head and shoulders pattern signals a reversal from an uptrend to a downtrend or vice versa. It looks like three peaks, with the middle peak (the head) higher than the two shoulders on either side. For example, if a currency pair like USD/KES forms this pattern after a sustained rise, it often means sellers are starting to take over, and prices may fall. In practice, traders watch for the price breaking the “neckline” connecting the lows between peaks as confirmation to sell or short.

The double top is another reversal sign where the price hits a resistance level twice but fails to break higher, suggesting a downward turnaround. For instance, if EUR/USD bounces twice near 1.10 without breaking through, it may indicate weaker buying momentum ahead. Conversely, a double bottom signals a shift from a downtrend to an uptrend when the price hits a support level twice, like USD/JPY bouncing twice near 105.00. In both cases, traders wait for price to move beyond the intervening low or high to confirm the reversal.
Triple tops and bottoms are similar to double patterns but involve three peaks or troughs at nearly the same price. These patterns offer stronger reversal signals by showing repeated failure to move beyond certain levels. For example, a triple top around KSh 110 may warn that the currency won’t rise further, and a decline might follow. Traders often expect bigger moves after the third touch, but patience is critical to avoid jumping in too early.
Triangles represent pauses during a trend and typically hint that the current trend will continue after consolidation. A symmetrical triangle has converging trendlines showing indecision, but once price breaks out, the previous trend usually resumes. Ascending triangles show rising lows against a flat resistance, often signalling bullish continuation as buyers gain strength, such as in Safaricom shares on NSE. Descending triangles, with lowering highs against flat support, suggest a bearish continuation. Traders use these shapes to position themselves for the breakout direction.
Flags and pennants are short-term continuation patterns that appear after a sharp price move. A flag looks like a small rectangle sloping against the trend, while a pennant is a small symmetrical triangle. Both show a brief pause before the price continues in the original direction. For example, the USD/KES might surge sharply, then form a flag shape before rising further. Identifying flags and pennants helps traders catch quick moves without entering too early.
Rectangles form when price moves sideways between parallel support and resistance lines, signalling indecision. Traders watch for a breakout from this range to confirm trend continuation. If the breakout is upward, it indicates buying interest; if downward, selling pressure. For example, if All Share Index on NSE moves between 150 and 160 points for weeks, a breakout might fuel the next leg up or down. Rectangles help traders set clear entry and exit points.
Recognising these common forex chart patterns and understanding their meanings can sharpen your market analysis, making your trading more confident and calculated.
Interpreting forex chart patterns accurately is key to making informed trading decisions. Overlooking subtle cues can lead to misguided entries or exits, costing you dearly. By understanding how to read these patterns properly, you gain an upper hand to predict market movements more confidently.
Not all chart patterns are trustworthy. Reliable patterns display clear shapes with defined highs and lows. Look for patterns that form over sufficient time periods; a head and shoulders formation lowering over days usually carries more weight than one emerging within a few hours. Also, check if the price action confirms the pattern by breaking the expected support or resistance levels. For example, a double bottom pattern followed by an upward breakout past the neckline often signals a buy opportunity. Beware of patterns appearing during low market activity, as these may give false signals.
Volume acts as a confirmatory tool alongside patterns. Increased trading volume during a breakout strengthens the pattern's validity. Consider a triangle pattern: if price squeezes tighter but volume spikes as it breaks out, that breakout is more likely genuine. Choose suitable time frames based on your trading style; a swing trader might focus on daily charts to capture broader trends, while day traders look at hourly charts for quick trades. Combining multiple time frames helps verify signals. For example, a bullish flag on a 4-hour chart aligning with a rising trend on the daily chart offers stronger conviction.
Jumping on patterns without confirmation is a frequent pitfall. Some traders enter trades as soon as a pattern forms, ignoring volume or trend context. This often leads to losses if the breakout fails. Another mistake is neglecting stop-loss orders; even reliable patterns can fail due to unexpected news. Over-trading patterns in choppy markets without clear trends can also drain your capital. Lastly, relying solely on chart patterns without considering economic events or market sentiment limits your understanding. Always balance technical findings with broader market context.
Accurate interpretation of forex chart patterns requires careful observation of pattern reliability, volume, and time frames, combined with avoiding common errors. Practising this skill steadily improves your trading edge.
Understanding these aspects helps you trade with more confidence, manage risks wisely, and make decisions backed by solid analysis rather than guesswork.
Having access to free PDF guides on forex chart patterns is a valuable resource for any trader looking to sharpen their skills without breaking the bank. These PDFs serve as portable references, allowing you to revisit important patterns and strategies at your own pace. For Kenyan traders, who might not always have steady internet access, downloading such materials means you can study offline anywhere — whether on the matatu during a commute or at home after work.
Trusted websites and forex education platforms often provide well-researched PDFs that cover both the basics and advanced concepts of forex chart patterns. Platforms such as BabyPips or DailyFX, for instance, are known for giving clear, practical guides that include detailed charts and examples. Since these sites rely heavily on user trust, their content usually stays updated with current market trends, ensuring you learn relevant trading strategies.
Using these online educational resources has a major benefit: the materials are often created by experienced traders and educators, reducing the risk of misinformation. Plus, many platforms offer additional support like quizzes or forums, helping you test your understanding as you go along.
Online forex forums and community resources are another excellent place for PDFs, especially if you want grassroots or local insights. Forums such as Trade2Win or specific Facebook groups for Kenyan traders sometimes share free PDFs tailored to different skill levels and market conditions. The advantage here is the chance to gather materials created by fellow traders who understand regional challenges such as market hours or regulatory factors.
Besides PDFs, these communities often provide discussion threads where you can clarify doubts and get advice on applying chart patterns in real-time trading. Such interactive support complements the static PDF documents, offering a richer learning experience.
When choosing a forex chart patterns PDF, prioritize clear explanations with examples. A good guide breaks down complex patterns into simple terms and includes annotated charts demonstrating how a pattern develops and what signals to watch for. This clarity helps avoid confusion, especially for traders new to technical analysis. For instance, a PDF that shows a head and shoulders pattern alongside real historical forex charts makes the lesson far more practical.
Also, look for PDFs offering up-to-date and practical strategies. Forex markets are dynamic, and trading techniques evolve with new tools and indicators. Outdated PDFs focusing only on traditional methods without mentioning recent developments such as incorporating volume data or multiple time frame analysis might limit your effectiveness. Ideally, the PDF should blend classic patterns like triangles with newer insights, helping you apply lessons in today’s fast-moving forex environment.
A dependable forex chart patterns PDF is not just theory on paper; it's a tool that guides you through reading live charts confidently and adapting as markets shift.
By choosing your resources wisely, you can build a solid foundation and improve your intuition for forex trading. Download, study, and pair these PDFs with practical charting software to get the most benefit.
Free PDF resources can be a valuable asset for anyone serious about improving forex trading skills. These documents often condense complex concepts into accessible formats, enabling traders to study at their own pace. In Kenya, where access to expensive courses can be limited or costly, free PDFs offer practical knowledge without the financial burden. Beyond theory, many PDFs include real trading examples, charts, and exercises tailored for beginners and intermediate traders.
Consistency is key when learning forex chart patterns through PDFs. Setting a study schedule helps break down the material into manageable chunks. For example, dedicating 30 to 45 minutes daily to reviewing a specific chart pattern or trading strategy keeps the information fresh and easier to absorb. This approach prevents overwhelming yourself by trying to learn too much at once, which can lead to confusion or burnout.
By organising your study time around quieter parts of the day—perhaps early mornings before work or evenings after dinner—you ensure uninterrupted focus. Often, a disciplined routine turns scattered learning into solid knowledge.
Reading alone won't guarantee mastery. Taking clear, concise notes while going through PDFs helps reinforce understanding and creates a personalised reference for future quick reviews. Highlighting key terms, marking patterns you find challenging, or jotting down examples can deepen comprehension.
Alongside this, applying the concepts on demo trading accounts is critical. Many brokers in Kenya offer free demo platforms where you can practise spotting chart patterns and making simulated trades without risking real money. This hands-on experience helps bridge the gap between theory and real-world application, building confidence before moving to live trading.
While PDFs deliver structured information, video tutorials add an interactive element that benefits visual learners. Watching an expert analyse live charts or demonstrate pattern recognition in real-time brings concepts to life, making it easier to grasp subtle details that words alone may not fully capture.
YouTube channels specialising in forex education or Kenyan trading platforms often have free material that complements PDF guides well. These videos provide step-by-step demonstrations, helping you to see practical setups and avoid common mistakes.
Engaging in live trading sessions and webinars offers direct interaction with experienced traders and instructors. These platforms often allow asking questions and receiving immediate feedback, which sharpens your knowledge further. Some sessions also focus on Kenyan market conditions, adding local relevance.
Webinars may cover how to adjust strategies to different timeframes or how to interpret volume alongside chart patterns. Participating actively in these sessions builds not only skills but also a sense of community with fellow traders facing similar challenges.
To improve your forex trading effectively, using free PDFs together with videos and live sessions creates a well-rounded learning experience. This mix allows you to study theory, watch practical examples, and engage with experts — all essential for developing confidence and success in Kenya's forex market.
📈 Learn to spot key forex chart patterns, interpret market moves, and boost your trading skills. Access practical tips plus PDF guides for easy study! 📊

📈 Learn to identify forex trading patterns crucial for Kenyan traders. This guide offers clear strategies plus practical PDF tools to boost your market understanding and decision-making.

📊 Explore seven essential chart patterns in technical analysis with our detailed PDF guide. Learn to spot key signals and improve your trading decisions easily!

📈 Discover key chart patterns traders use to spot market trends. Learn how to interpret and apply them with handy PDF resources for smarter decisions.
Based on 13 reviews