

Using Deriv and TradingView Together: A Trader's Guide
Explore how to combine Deriv and TradingView for smarter trading in Kenya 🇰🇪. Learn to use chart tools, technical analysis, and manage trades better 📈💼.
Edited By
Emily Watson
TradingView has become a go-to tool among Kenyan traders and investors for its detailed, user-friendly charts. Combining it with Deriv, a popular online trading platform, allows users to step up their game by accessing advanced technical analysis directly where they trade. This setup can improve decision-making and shape more refined strategies.
TradingView offers versatile charts that cover forex, indices, commodities, and cryptocurrencies, all relevant markets on Deriv. Its interface features multiple timeframes, numerous technical indicators, and drawing tools for trend analysis. Unlike Deriv’s native charts, TradingView lets you customise views extensively to match your trading style.
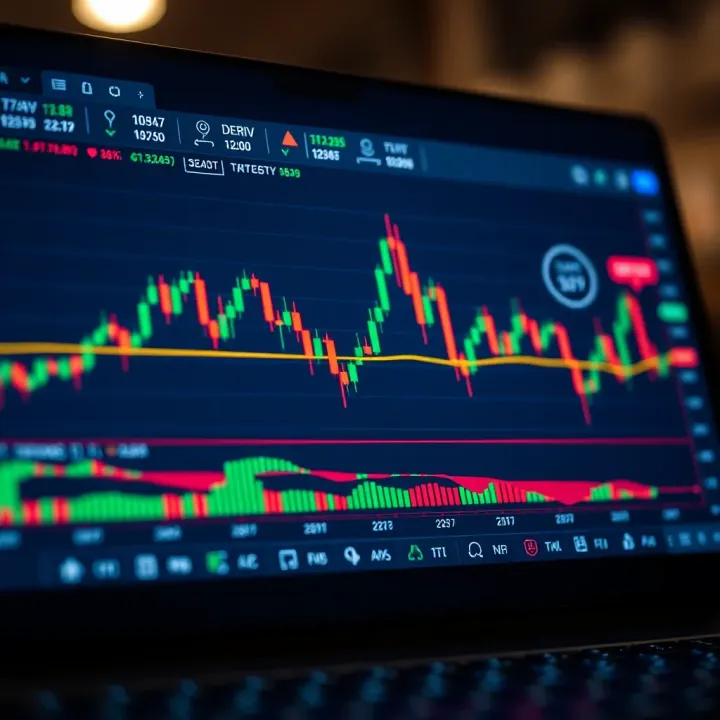
Integrating TradingView with Deriv does not just mean importing charts. It’s about enhancing your workflow by overlaying Technical Indicators and trend lines in real-time while executing trades smoothly on Deriv’s platform. Kenyan traders, whether experienced or newbies, find this combo especially useful for spotting entry and exit points.
Consider the trade-off: Deriv offers direct order execution with a simple chart, but TradingView provides the depth for complex analysis. Using both tools together balances speed with insight, crucial for markets as volatile as forex.
Here’s why this matters:
Access to More Indicators: TradingView comes with hundreds of indicators compared to Deriv’s standard set.
Customisable Layouts: Save chart setups tailored to your preferred strategy, like swing or day trading.
Community Ideas: TradingView’s social platform connects you with other traders, which can be invaluable for fresh perspectives.
This guide will show you how to link the two platforms step-by-step. You’ll also get tips on navigating common issues and optimising settings for the Kenyan market. By the end, you’ll be able to harness TradingView’s power seamlessly on Deriv, optimising both analysis and execution.
Trading is more than just watching charts – it’s about making the right move at the right time. With this combination, you’re better placed to do exactly that.
Understanding TradingView and its benefits is key for any trader using Deriv. TradingView offers advanced charting tools and robust technical indicators that go beyond the basic visuals available on many platforms. By integrating it with Deriv, traders gain clearer insight into market trends and asset performance, which directly supports better-informed trading decisions.
TradingView provides a detailed, interactive interface where traders can view price movements in various chart formats like candlestick, line, and bar charts. These visual options help traders to spot patterns or trend reversals quickly. For example, a trader watching forex pairs on Deriv can switch from a one-minute to a four-hour chart seamlessly, spotting the real direction of price action.
One of TradingView’s strengths is its rich library of technical indicators—moving averages, Bollinger Bands, MACD, RSI and more. These are essential for evaluating momentum and potential entry or exit points. Plus, drawing tools let you sketch trendlines, support and resistance levels, or Fibonacci retracements right on the chart. This hands-on approach makes it easier to grasp market psychology at a glance.
TradingView also hosts a vibrant community where traders share ideas, strategies, and custom scripts. Access to these shared resources means you can try out tested methods or create your own scripted indicators to match your trading style. In Kenya’s growing online trading scene, tapping into this social layer offers practical insights beyond textbook analysis.
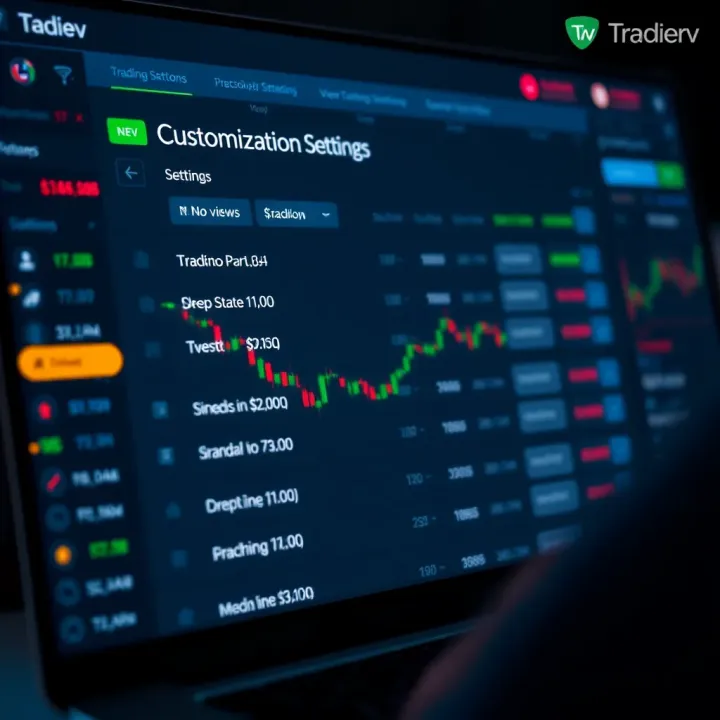
Deriv’s platform supports a range of assets like forex, commodities, and cryptocurrencies. TradingView enhances the visual quality and depth of market data viewable on Deriv, allowing traders to observe price movements more clearly and spot subtleties such as candlestick patterns or volume changes. This visual edge helps traders adjust their strategies swiftly.
While Deriv has its native tools, TradingView’s broader suite of indicators and chart types expands analytical possibilities. For instance, a trader analysing gold prices on Deriv can apply advanced oscillators or specialise in harmonic patterns using TradingView, gaining a sharper edge on entry timing.
TradingView’s interface is user-friendly, with intuitive controls that work smoothly whether on desktop or mobile. When integrated with Deriv, this familiarity reduces time wasted navigating different platforms. Instead, you focus on analysis and rapid execution. Also, TradingView allows saving custom layouts, so you return to your preferred setup anytime.
Leveraging TradingView on Deriv doesn’t just improve charts; it makes your entire trading approach sharper, faster, and more adaptable to market movements.
Combining these tools bridges practical analysis with swift execution—offering traders in Kenya and beyond a reliable setup to sharpen their trading performance.
Setting up TradingView integration on Deriv is an important step for traders who want to enhance their charting and analysis. By connecting these two platforms, you gain access to TradingView’s advanced tools directly within Deriv’s environment, streamlining your workflow and improving your trading decisions. A well-configured setup means real-time data sync, reduced switching between apps, and smoother operations when tracking market movements.
Signing up for TradingView is straightforward but requires attention to detail since your TradingView profile will hold all your customised charts and settings. Registration only needs a valid email address or social login, but be sure to confirm your account early to avoid disruptions. This practical step ensures your work is saved on TradingView’s cloud, so if you switch devices or browsers, your configurations remain intact.
Choosing the right plan for your needs depends largely on your trading style and frequency. The free plan suits casual traders who need basic charts and a limited number of indicators. However, if you actively trade on Deriv, consider the Pro or Premium plans to access extra features like multiple device logins, more indicators per chart, and faster data refresh rates. For instance, an active day trader in Nairobi might find the Pro plan provides just enough extras without burdening them with unnecessary costs.
Accessing Deriv’s platform for chart integration typically involves logging into your Deriv account and locating the chart settings area. Deriv has made this relatively simple by providing options to embed or connect external chart services like TradingView. Navigating to Deriv’s 'Advanced Chart' section reveals the integration features, allowing you direct access to embed TradingView’s charts without complicated steps.
Embedding or connecting TradingView within Deriv usually requires pasting your TradingView chart URL or using provided API keys, depending on the integration method Deriv supports. This connection brings live TradingView charts into your Deriv workspace, exposing sophisticated indicators and drawing tools that Deriv’s default charts might lack. This setup also saves you from juggling two windows, keeping your focus sharp during the trading session.
Verifying the connection is crucial before you start trading with TradingView on Deriv. After embedding the chart, check that the data updates in real time and that your custom indicators appear correctly. For example, if you set a Moving Average Convergence Divergence (MACD) indicator in TradingView, it should be visible and responsive within the Deriv interface. Any lag or missing features signal connection issues needing timely troubleshooting.
Troubleshooting chart loading errors often relates to internet connectivity or browser compatibility. Sometimes, due to slow or unstable connections, TradingView charts may not fully load within Deriv. To fix this, clear your browser cache, update your browser version, or switch to a more stable network. If the problem persists, disabling some browser extensions can help, as some may block required scripts.
Addressing login and permissions problems usually comes up when TradingView requires a fresh login or if account credentials aren’t properly synced between platforms. Ensure you’re logged into the correct TradingView account linked with your Deriv profile. Should permission requests pop up, grant them so Deriv can access your chart data seamlessly. If issues remain, logging out and back into both Deriv and TradingView often resets connection permissions effectively.
Smooth integration makes a difference; investing time to set up TradingView on Deriv properly pays off with better chart insights and quicker trading decisions.
Setting up TradingView on Deriv may seem technical at first, but following these steps ensures you gain a powerful edge in the market with real-time, advanced analysis tools right at your fingertips.
Using TradingView on Deriv unlocks a range of tools that can significantly improve how you analyse markets and make trading decisions. It’s not enough to just have access to the charts; you need to customise and utilise the features to suit your trading style. This section covers how to tailor your chart layout and how alerts can keep you ahead of market moves, especially important for traders in Kenya where market hours and volatility can vary.
Selecting time frames and chart types is the first step towards meaningful analysis. Whether you trade short-term options or longer-term CFDs on Deriv, choosing the correct time frame helps you spot trends or reversals. For example, a scalper might use 1-minute or 5-minute charts, while a swing trader prefers daily or weekly views. TradingView allows selecting chart types such as candlestick, line, or Heikin-Ashi. Candlestick charts, popular among Kenyan traders, visually represent price action which shows market sentiment clearly.
Adding and adjusting indicators enhances your chart’s insight. Deriv traders often rely on Moving Averages, RSI (Relative Strength Index), and MACD (Moving Average Convergence Divergence). TradingView lets you add multiple indicators and tweak their settings – such as changing the period of an RSI from 14 to 9 for a faster signal. Adjusting indicator parameters to fit Deriv’s asset volatility can improve trade timing. You might, for instance, reduce Moving Average periods for forex assets with swift price movement, common during Kenyan market mornings.
Using drawing tools for better analysis makes predictions clearer and helps track support and resistance zones. Traders on Deriv can draw trend lines to spot breakouts or use Fibonacci retracement for potential reversal points. These tools are especially handy when trading outbreaks or dips on currency pairs like USD/KES, helping avoid chasing false moves. For instance, drawing resistance at a previous high can guide you on where to set stop-loss orders, reducing risk exposure.
Setting up alerts for price levels on TradingView ensures you don’t miss critical moments. Instead of constantly watching price charts, you can configure alerts to notify you when an asset crosses a target price or when an indicator reaches a specific threshold. For example, you can set an alert when the EUR/USD crosses 1.2000 or RSI goes above 70, signalling an overbought condition.
How alerts can assist in Deriv trading is by freeing up your attention and increasing efficiency. Alerts mean you won’t have to sit glued to the screen waiting for price action, fixing the challenge many Kenyan traders face amidst daily hustle or juggling work. They allow timely execution of trades on Deriv, improving entry and exit points. Plus, alert notifications via email or mobile push messages ensure you stay updated even while on the go, which is essential if you trade outside Nairobi or have unreliable internet at times.
Mastering these features on TradingView can give Deriv traders an edge by sharpening technical analysis and making trading more responsive to market movements. Customisation plus alerts make your trading sharper, less stressful, and more aligned with your trading goals.
Using TradingView on Deriv can dramatically improve your trading decisions, but only if you apply some smart tips and best practices. Proper use ensures smoother chart performance, clearer analysis, and a better integration of TradingView’s rich tools with Deriv’s trading functions. Focusing on these aspects not only saves you time but also sharpens your edge in the fast-moving markets.
Managing multiple charts effectively is essential for traders dealing with diverse assets or time frames. Instead of cluttering your screen with numerous open charts, consider grouping charts by asset class or strategy. For example, you might keep forex charts on one tab and indices on another. This reduces cognitive overload and allows you to switch focus quickly without losing important viewpoints. Also, limit the number of charts running simultaneously to what your device and internet connection can handle; too many open charts can slow down performance and disrupt your workflow.
Balancing indicators for clarity is about choosing the right mix of technical tools without overwhelming the chart. Applying too many indicators often leads to contradictory signals and confusion. Focus on two or three key indicators that complement each other, such as a moving average for trend direction and RSI (Relative Strength Index) for momentum. This approach prevents the chart from looking messy and helps you make clear decisions. Periodically review your indicators to ensure they still serve your strategy rather than just staying because you added them once.
Combining TradingView insights with Deriv tools gives you a fuller picture before placing trades. TradingView offers detailed charting and community ideas, while Deriv provides price feeds, order management, and trade execution. Use TradingView to spot entry and exit points with customised indicators, then execute trades on Deriv using its risk management features like stop-loss and take-profit limits. For instance, if TradingView signals a breakout on a currency pair, confirm it with Deriv’s market data and place your order promptly with protective stops.
Approaches to risk management are key when acting on TradingView analysis through Deriv. No signal is foolproof, so always use stop-loss orders and calculate position sizes based on your risk tolerance. For example, risking 1–2% of your trading capital per trade usually keeps losses manageable. Additionally, diversify your positions across different assets on Deriv, and avoid chasing trades just because a TradingView indicator suggests it. Balancing caution with confidence improves your chances of sustainable profits.
Successful traders on Deriv using TradingView don’t just rely on flashy indicators—they combine practical chart management and sound risk controls to trade smarter, not harder.
By following these best practices, you make the most of TradingView’s features on Deriv while keeping your trading clear, fast, and disciplined.
Explore how to combine Deriv and TradingView for smarter trading in Kenya 🇰🇪. Learn to use chart tools, technical analysis, and manage trades better 📈💼.

📈 Learn how to use TradingView with Deriv to analyze charts, monitor signals, and boost your trading decisions effectively in Kenya's market.

📈 Learn how to integrate Deriv with TradingView for a smoother trading experience. Discover setup steps, tech needs, benefits, and tips for Kenyan traders.
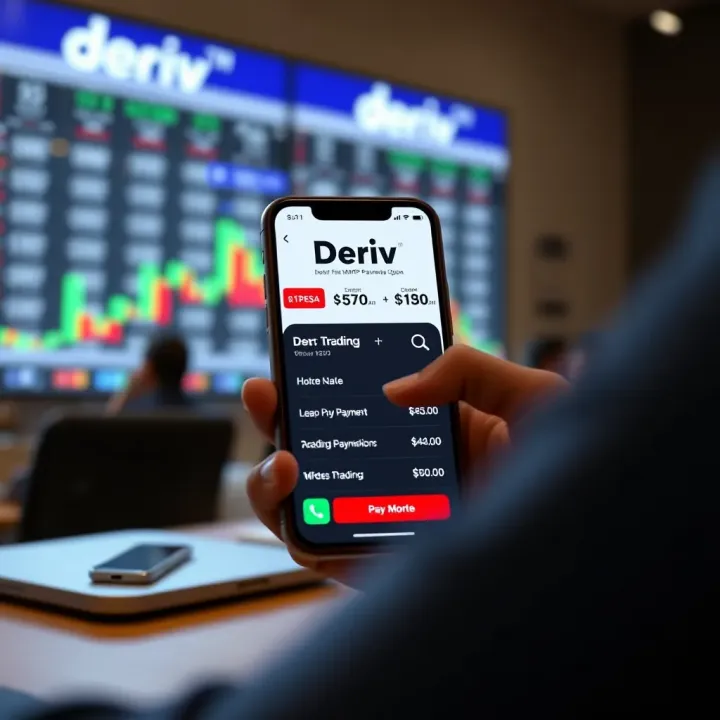
Learn how to trade on Deriv using MPesa 📱💸 with easy deposit & withdrawal steps, security tips, and solutions to common issues for Kenyan users.
Based on 12 reviews