
Using TradingView with Deriv for Smarter Trading
📈 Learn how to use TradingView with Deriv to analyze charts, monitor signals, and boost your trading decisions effectively in Kenya's market.
Edited By
Elizabeth Cole
TradingView has become a go-to platform for many Kenyan traders and investors looking to analyse financial markets, including forex, stocks, and cryptocurrencies. It's not just about the pretty charts; TradingView offers a detailed view of price movements and market trends that can help you make wiser trading decisions.
At its core, the TradingView chart interface combines simplicity and depth. You can start by selecting a market — whether it's NSE-listed stocks, forex pairs like USD/KES, or Bitcoin. The interface then presents you with real-time price charts that update quickly, essential for spotting entry and exit points.
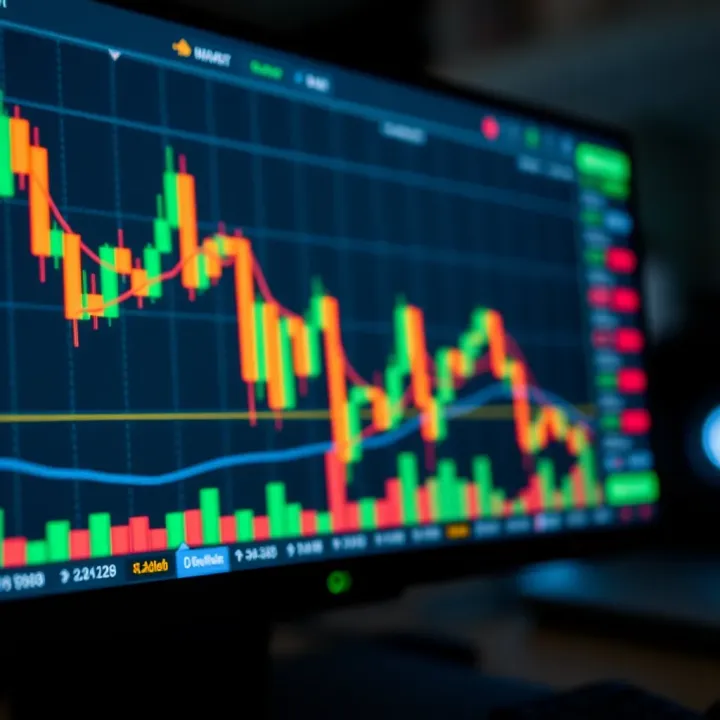
Charts come in various styles such as line, bar, and candlestick — the latter being most popular among Kenyan traders since it clearly shows open, high, low, and close prices in one glance. Each chart type serves a different purpose; for instance, candlesticks help identify price patterns that may signal trends.
Beyond visualising price movements, TradingView lets you overlay technical indicators like Moving Averages, Relative Strength Index (RSI), or Bollinger Bands. These tools boost analysis by offering insight into momentum, volatility, and potential reversals.
Customising your charts is straightforward. You can adjust timeframes—from minutes, hours, to daily or weekly views—allowing you to focus either on quick flips or long-term investments. Colours and chart layouts are also configurable to match your preference, which helps reduce eye strain during long trading sessions.
Remember, understanding the nuances of each chart component helps you pick the right signals and avoid misleading ones.
In practice, you might watch the EUR/USD forex pair on a 15-minute candlestick chart, applying a 20-period Moving Average to spot short-term trend shifts. Alternatively, if you’re investing in Safaricom shares, a daily chart combined with volume indicators reveals buying interest over weeks.
Using TradingView charts effectively means blending its tools with your trading style. Whether you are a broker analysing market depth or a jua kali entrepreneur tracking commodity prices, grasping these basics sets the stage for better-informed moves.
Starting with TradingView charts is essential for any trader or investor wanting to make better decisions. Understanding how to access the platform, navigate its interface, and create your first chart sets the foundation for effective market analysis. Without grasping these basics, traders risk misreading price moves or missing opportunities in fast-changing markets like forex, stocks, or cryptocurrencies.
TradingView is a broadly accessible tool used globally to analyse financial markets with ease. It shows real-time price data, drawing tools, and technical indicators all in one place — making it easier for traders to spot trends and plan their trades.
For traders in Kenya, TradingView offers a practical way to keep an eye on both local stocks on the Nairobi Securities Exchange (NSE) and global markets without installing heavy software. It's designed to fit different trading styles, whether you are a day trader, long-term investor, or just tracking your portfolio.
TradingView works on multiple fronts: you can use it on a web browser without downloads, via mobile apps for trading on the go, or desktop versions for more powerful setups. For example, a Nairobi-based trader can quickly check charts on their phone while commuting in a matatu, then switch to a desktop at home for a detailed study using multiple screens.
Once you open TradingView, the chart interface greets you with a clean main panel displaying the price movements. Around this, you'll find the toolbar with drawing tools, indicator selection, and a watchlist panel. Knowing where these sections lie helps you jump straight to the needed feature without fumbling.
Timeframes are among the most important controls. You can switch easily from a quick 1-minute chart to daily or weekly views. This flexibility matters because short timeframes help spot quick trades, while longer ones show bigger trends. For instance, a forex trader might watch 15-minute charts to scalp pips but check daily charts for overall trend confirmation.
Every asset you analyse comes tagged with a symbol or ticker, like NSE:EQTY35 for Equity Bank or NASDAQ:AAPL for Apple Inc. Understanding these symbols ensures you work with the correct asset, avoiding costly mistakes like examining data for a wrong stock or currency pair.
Getting started means searching for your asset in the search box. Simply enter the company name, ticker, or currency pair. For example, typing “Safaricom” will bring up SCOM data so you can start your analysis immediately. Selecting the right market is crucial since some stocks appear on multiple exchanges.
After choosing the asset, pick your preferred chart type. TradingView supports basic charts like line, candlestick, and bar charts. Candlestick charts, for example, give detailed insight into price action by showing open, close, high, and low prices in each time period. This helps traders interpret market momentum better than a simple line graph.
Remember, mastering these initial steps makes the rest of your TradingView experience smoother and more productive. Take the time to explore each function, and you will build confidence in your trading decisions.
By learning the platform's access methods, layout, timeframes, symbols, and chart setup, you prepare yourself to analyse markets effectively. From here, it is easier to add indicators, set alerts, and develop strategies tailored to your trading style and goals in the Kenyan market and beyond.
Understanding different chart types and how to use them is essential for any trader or investor using TradingView. Different chart styles reveal various aspects of price movements and market behaviour, which can influence your trading decisions. By grasping when and why to use each chart type, you gain clearer insight into trends, support and resistance levels, and market sentiment.
Line charts connect closing prices over a selected time frame, forming a simple, continuous line that shows the general movement of an asset's price. This style strips out the noise from intraday fluctuations, making it useful for spotting overall trends without distraction. For instance, a Kenyan trader following the NSE All Share Index (NASI) might use a line chart to quickly gauge the market’s general direction over several months.
Line charts are ideal for beginners or analysts focused on broad market movements rather than detailed entry points. However, they don’t provide information about price volatility or intraday highs and lows.
Candlestick charts are the most popular and detailed style on TradingView. Each candle shows the opening, closing, high, and low prices within a chosen timeframe. The colour coding (usually green for up and red for down) lets traders quickly identify bullish or bearish momentum. Kenyan traders dealing with forex pairs like USD/KES often rely on candlesticks to spot reversal patterns or confirm trend strength.
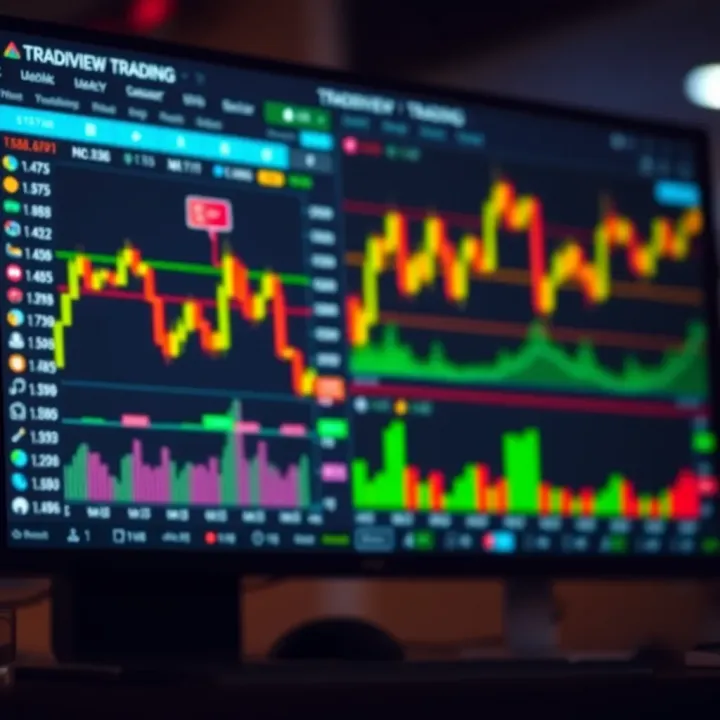
Candlestick formations such as 'Doji' or 'Engulfing' provide valuable clues on market sentiment shifts, helping traders time their entries and exits better than line charts.
Bar charts also display open, high, low, and close prices but use vertical bars and horizontal ticks instead of candles. Though less visually rich compared to candlesticks, some traders find bar charts clearer, especially for spotting price ranges and volatility.
For example, a trader analysing the volatile cryptocurrency market might prefer bar charts to examine daily ranges more precisely. Despite their less colourful presentation, bar charts remain a solid option for technical analysis.
Choosing the right chart type depends largely on your analysis goal. For spotting clear trends over weeks or months, line charts offer a neat overview without distraction. If you want to study price action closely to understand momentum and turning points, candlestick charts provide more granularity.
A trader watching NSE-listed shares like Safaricom or Equity Bank can use candlestick charts to identify key support and resistance levels, then switch to line charts for a broader perspective on longer-term trends.
Volume confirmation is often integrated with candlestick and bar charts since they offer detailed daily price moves. When paired with volume bars, these charts help traders judge whether price moves carry strength or are likely to fade.
For instance, if Safaricom’s candlestick chart shows a strong green candle with high volume, it signals robust buying interest, guiding traders to buy or hold positions. Conversely, low-volume price moves might warn of weaker trends.
Selecting the suitable chart type shapes your trading insights. Use line charts for a clean trend view, candlesticks for detailed price action, and bar charts when you want precise price range analysis.
Tools and indicators form the backbone of technical analysis on TradingView. They help traders interpret price movements, spot trends, and find entry or exit points more confidently. Without them, chart data is just lines and candles, but with well-applied tools, you can translate those visuals into actionable insights. In Kenya’s dynamic markets, especially with NSE stocks and forex pairs, knowing how to use these tools can make a real difference in trading outcomes.
Technical indicators like the Relative Strength Index (RSI), Moving Average Convergence Divergence (MACD), and Moving Averages are among the most widely used on TradingView. The RSI helps identify overbought or oversold conditions, signalling when a market might reverse. For example, if the RSI for Safaricom shares hits above 70, it might caution traders that the stock is overbought. MACD measures momentum and possible trend changes. Moving Averages smooth out price data, showing the average price over a set period which can highlight support or resistance levels.
Adding indicators on TradingView is straightforward. You click the ‘Indicators’ button on the chart toolbar, search for your desired tool, and add it to your chart. Removing or hiding indicators is just as simple—right-click the indicator pane or use the context menu to delete or pause it. This flexibility lets you experiment by layering multiple indicators or focusing on just a couple that fit your trading style.
Drawing tools help visually mark important price points or patterns that raw charts don’t immediately show. Trendlines, for instance, are straight lines drawn along highs or lows to indicate direction. Kenyan traders often use trendlines to spot when NSE counters might break out or pull back. Support and resistance lines mark price levels where the market has historically reversed, giving clues about where price might stall or rebound.
Fibonacci retracement is another popular drawing tool. It uses horizontal lines based on ratios to identify likely reversal levels during price corrections. Traders on forex pairs involving the Kenyan Shilling, like USD/KES, find Fibonacci levels especially helpful in planning entries and stops. Other patterns, such as head and shoulders or double tops, can also be sketched on charts to anticipate potential moves.
Saving your chart layouts is a practical step that improves your workflow. After setting up indicators, drawing tools, and preferred timeframes, saving these configurations means you can open TradingView each day without repeating setup work. This is useful for busy traders who want to scan several markets efficiently.
Alerts and notifications add another layer of convenience. You can set TradingView to notify you via the app, email, or SMS when price hits specific levels or when an indicator triggers a certain condition. For example, you might want an alert when NSE 20 Index dips below a key moving average, so you can act quickly without watching the screen constantly.
Using tools effectively on TradingView lets you transform market data into clear signals, helping you trade smarter rather than harder, especially in Kenya’s fast-moving trading environment.
By combining technical indicators, drawing tools, and personal chart setups, you build a toolkit that adapts to your strategy and the markets you follow.
Kenyan traders benefit greatly from tailoring their TradingView experience to local market conditions and realities. Practical tips that focus on the Nairobi Securities Exchange (NSE), local currency movements, integration with Kenyan brokers, and risk management are essential for effective decision-making. Understanding how to use TradingView with Kenya’s financial landscape can save time and protect capital.
TradingView provides detailed charting and analysis tools for NSE-listed stocks, allowing Kenyan traders to access real-time and historical price data. For example, an investor tracking Safaricom’s share prices can use TradingView to spot trends, identify support and resistance levels, and make timely buy or sell decisions. This is valuable because local market hours, liquidity, and price movements differ significantly from global markets.
TradingView also helps monitor NSE indices like the NSE 20 or the All Share Index, which reflect broader market health. Kenyan traders can combine these insights with local economic news to better time their trades.
The Kenyan Shilling fluctuates visibly against major currencies such as the US dollar (USD) and the Euro (EUR). Using TradingView to monitor KES currency pairs equips traders and businesses with vital information for forex trading or managing import-export risks. For instance, a forex trader may track the USD/KES pair to decide when to enter or exit positions.
Since the KES market reacts to factors like Central Bank of Kenya policies and regional economic developments, continuous chart monitoring through TradingView keeps traders well-informed. Understanding intraday and weekly currency patterns also allows better timing of remittances or foreign inflows.
Kenyan brokers increasingly support TradingView integration, enabling users to place trades directly or use TradingView’s analytical data alongside broker platforms. For example, some brokers may allow syncing watchlists or chart layouts to their trading portals, creating a unified experience. This integration helps traders avoid toggling between multiple windows, making it easier to act quickly during market swings.
It's practical for traders to confirm how their broker supports TradingView data, whether through API access or dedicated apps, to optimise trade execution speed and accuracy.
Funding trading accounts quickly and securely is crucial. Many Kenyan brokers accept deposits via M-Pesa, which is convenient and widely accessible even outside major cities. Linking M-Pesa to brokerage accounts means traders can fund or withdraw money without visiting physical bank branches.
Using M-Pesa reduces friction, enabling traders to react to market opportunities promptly. Additionally, it caters to the hustle economy where fast, mobile money transfers are preferred over traditional banking.
TradingView’s tools let traders impose stop-loss and take-profit points directly on charts to limit losses or secure gains. For example, if a trader buys an NSE stock at KSh 300, they might place a stop-loss at KSh 280 to cap losses if the price drops. Meanwhile, a take-profit at KSh 350 helps lock in profit when the target price hits.
This practice controls risk without needing constant market watch, which is especially useful for traders balancing other commitments or using mobile devices.
Volatility can spike suddenly in NSE stocks or KES pairs due to various factors like political events, harvest seasons affecting commodity prices, or global shocks. TradingView charts visually display volatility through indicators and price swings, helping traders adjust strategies accordingly.
For instance, a trader may avoid entering big positions during election periods or around CBK announcements because of expected price swings. Spotting such periods on charts and combining them with calendar events enables smarter risk management.
Practical use of TradingView with local data and payment methods empowers Kenyan traders to trade smarter and safer, enhancing their chances for sustainable success.
By focusing on these practical tips—local market specifics, smooth trading integrations, and solid risk controls—traders in Kenya can make better use of TradingView’s powerful features tailored to their environment.
TradingView offers more than just basic charting. Its advanced features and community resources give traders and investors extra tools to boost analysis and decision-making. These include alerts and automated trading signals, access to shared strategies and custom scripting, plus real-time news integration for market updates. Using these elements well can enhance your trading speed, precision, and adaptability.
Setting conditional alerts lets you monitor specific price movements or indicator changes without staring at the screen all day. For instance, you can set an alert to notify you when the NSE 20 index hits a support level or when the Relative Strength Index (RSI) crosses below 30, signalling oversold conditions. This proves crucial in Kenyan markets where price swings might happen beyond usual trading hours or when you juggle multiple assets.
TradingView’s alert system supports various triggers – price levels, indicator values, or even custom Pine Script conditions. Upon triggering, it sends a notification via app, email, or SMS, so you catch opportunities or risks on time. This practical feature helps cut down emotional trading by keeping watch for you, whether you're at the duka or on your way home in a matatu.
One of TradingView’s strengths is its active community where traders share chart setups, trading ideas, and strategy scripts publicly. By exploring these shared resources, you can learn proven approaches or spot fresh perspectives on markets like forex pairs involving the Kenyan Shilling (KES) or global commodities. For example, a local trader might post a trading idea predicting caffeine price moves, useful for coffee exporters.
Pine Script, TradingView’s own coding language, allows traders to tweak or build custom indicators based on personal strategies or market behaviour. If a standard moving average doesn’t cut it, you can modify it with Pine Script to reflect a specific Kenyan market nuance, like incorporating NHIF release seasons affecting certain stocks. Custom scripts give flexibility no ready-made indicator offers.
Integrating economic calendars and news feeds directly into TradingView helps you stay ahead of events that influence markets. For Kenyan traders, this means receiving updates on inflation figures, CBK announcements, or NSE quarterly results right on the chart platform. These timely insights aid planning your entry or exit points.
Following global and local market developments is essential since Kenyan stocks and forex pairs often respond to international trends. Watching for news on the US Federal Reserve, oil price changes, or East African Community trade shifts becomes easier when delivered through TradingView’s news tabs. You get a full picture without constantly switching between apps or websites.
Use TradingView’s advanced tools to make your trading smarter, not just busier. Alerts keep you informed, community scripts fuel creativity, and news updates shape your understanding – all key to staying competitive in Kenya’s dynamic markets.
This combination of features helps you manage trades more confidently, spot new opportunities faster, and adapt quickly as market conditions shift locally and globally.
📈 Learn how to use TradingView with Deriv to analyze charts, monitor signals, and boost your trading decisions effectively in Kenya's market.
📈 Master binary options trading with TradingView charts! Learn to analyze trends, use key indicators, and manage risks for smarter trades in Kenya 🇰🇪.
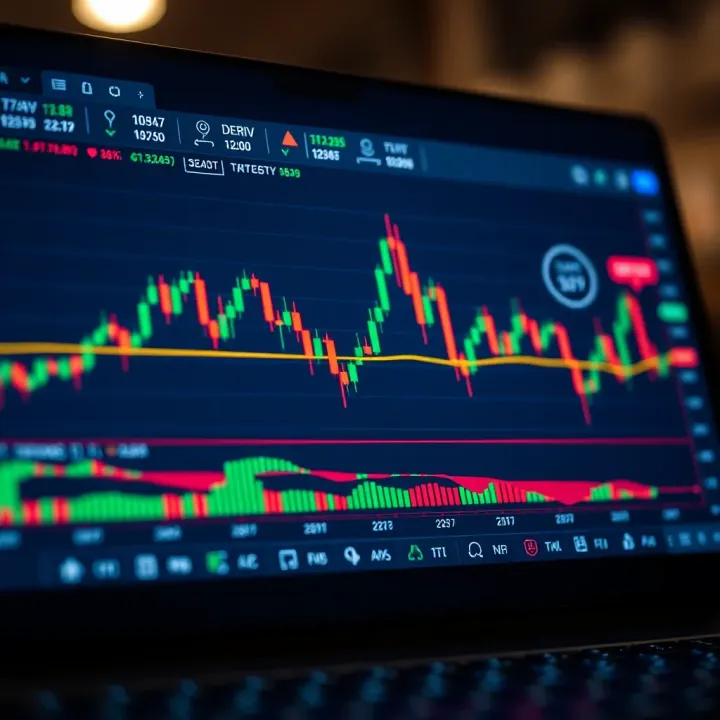
Integrate TradingView's advanced charts on Deriv easily 🖥️. Step-by-step setup, customisation tips, and solutions for a smoother trading experience on this popular Kenyan platform.
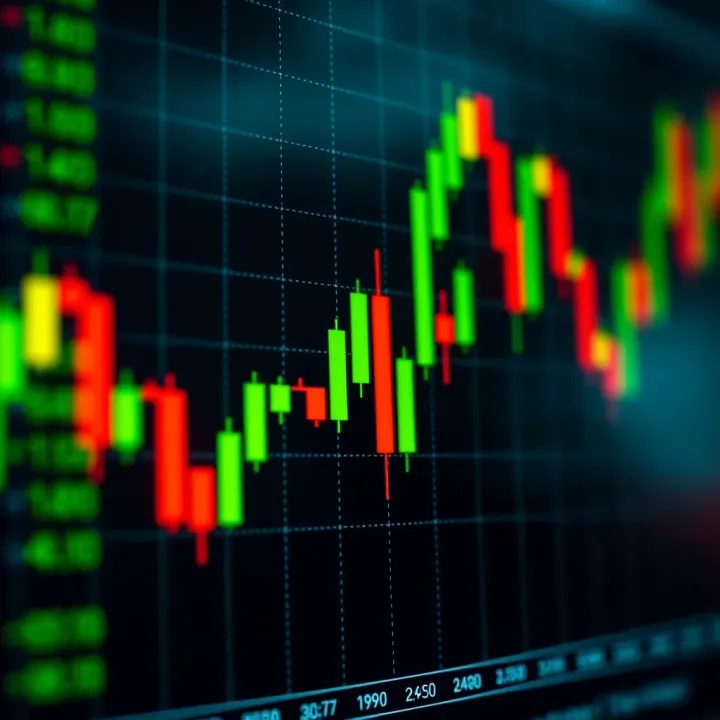
📊 Learn how to read and use trading charts effectively to spot trends and make smart decisions. A practical guide tailored for Kenyan traders navigating local markets.
Based on 10 reviews