
Understanding Deriv Trading in Kenya
Explore Deriv trading in Kenya 📈 - learn how to trade forex, commodities & indices safely, master strategies, manage risks, and make smart investment choices.
Edited By
Charlotte Davies
Trading charts are the backbone of analysing price movements in financial markets. For Kenyan traders dealing with stocks listed on the Nairobi Securities Exchange (NSE), forex trading, or commodities like tea and coffee, grasping how to read these charts is vital. They transform complex market data into simple visuals, giving you a clearer view of trends, support, and resistance levels.
Unlike guessing or relying on tips, charts offer solid clues about where prices might head next. Every tick, candle, or bar on a chart represents real trading activity over a set time—whether seconds, minutes, or days. This helps you spot patterns and make decisions backed by data rather than speculation.
Kenyan traders face unique challenges, such as market volatility tied to local economic updates or political events, and liquidity differences compared to global markets. Therefore, understanding chart fundamentals helps adapt your strategies effectively.
Visual data from trading charts allows you to cut through noise and focus on meaningful price action, improving your chances to buy or sell at the right moment.
Identify Trends Early: Spot when a stock like Safaricom or a foreign exchange pair is gaining or losing momentum.
Manage Risks: Set stop-loss points based on chart signals to protect your investment.
Time Entries and Exits: Know when to enter a trade or close a position by reading chart patterns.
Most local traders use platforms offering candlestick charts, which show open, high, low, and close prices within each period. For example, you can watch KCB Group's stock fluctuating during a trading day and identify moments worth jumping in or out.
Also, combining chart reading with news from KRA tax changes or CBK monetary policy announcements helps make informed calls. For instance, a chart might show a build-up before a price breakout triggered by a favourable interest rate decision.
Mastering trading charts isn't just for forex geeks or Nairobi stockbrokers; it’s a skill every Kenyan trader can develop to improve outcomes. This guide will take you through the types of charts, reading techniques, and how to adapt these tools to Kenya’s market nuances.
Trading charts are graphical tools that show how prices of assets like stocks, currencies, or commodities move over time. They help traders follow market behaviour by putting complex price data in a visual format that's easy to understand. For Kenyan traders, these charts offer clear signals on when to buy or sell, saving them from guessing and making uninformed decisions.
Charts turn numbers into pictures, showing price steps from one point to another. For example, a line chart might track Safaricom’s share price over a week, letting you see if it's generally going up, down, or staying steady. This is helpful because raw numbers can be overwhelming; charts give a quick snapshot of what’s happening in the market.
Beyond just showing prices, charts help spot patterns—like a steady upward climb or a sudden dip followed by recovery. These trends tell you if an asset is gaining popularity or losing support. For instance, when a stock regularly bounces back after hitting a certain low price, that price forms a "support level". Spotting such trends helps Kenyan traders time their moves better, avoiding buying at a peak or selling during a temporary drop.
Charts guide traders on when to act. If the chart shows a strong trend upwards, it might be time to buy. Conversely, if a downward trend is visible, it could mean time to sell or avoid the asset. For example, during NSE trading, following chart patterns can alert you to a breakout—when prices jump beyond usual limits, signalling a buying opportunity. This kind of insight saves money and increases gains.
Kenyan markets have unique rhythms. Agricultural commodity prices, NSE stocks, and forex rates react to local events like election cycles, weather changes affecting crops, or CBK monetary policy announcements. Trading charts help by reflecting these local factors quickly. A maize price chart, for example, will show seasonal spikes during drought periods, allowing traders and farmers to plan accordingly.
Many Kenyans use M-Pesa for managing investment funds and trading accounts. Charts accessible on mobile platforms integrate smoothly with M-Pesa payment options, making it easier to fund trades or withdraw profits. For instance, a trader can review their forex position on a smartphone app and quickly transfer funds through M-Pesa without visiting a bank, providing both convenience and speed.
Trading charts are essential for navigating both NSE stocks and forex markets. In NSE, charts help spot breakout opportunities or dips, crucial for deciding when to buy popular counters like KCB or Equity Bank. Forex traders watching the Kenyan shilling against the US dollar rely on charts to manage risk, for example, by using candlesticks to anticipate currency swings caused by global events or trade balances. These visuals enable more precise timing than guessing based on news alone.
Well-used trading charts turn market data into actionable information, helping Kenyan traders stay ahead and protect their investments efficiently.
Trading charts come in different forms, each serving distinct purposes for traders. Understanding these types helps you to pick the right one depending on your trading style and market. Kenyan traders dealing in stocks on the Nairobi Securities Exchange (NSE), forex pairs, or commodities benefit greatly by choosing the chart that clearly shows what they need at a glance.
Plotting closing prices: Line charts connect closing prices over set periods, like daily or weekly closes. For example, when monitoring Safaricom shares, line charts easily show whether prices are generally climbing or falling without distraction. This simplicity makes it a good starting point for beginners or anyone wanting a quick overview without the clutter of detailed price action.
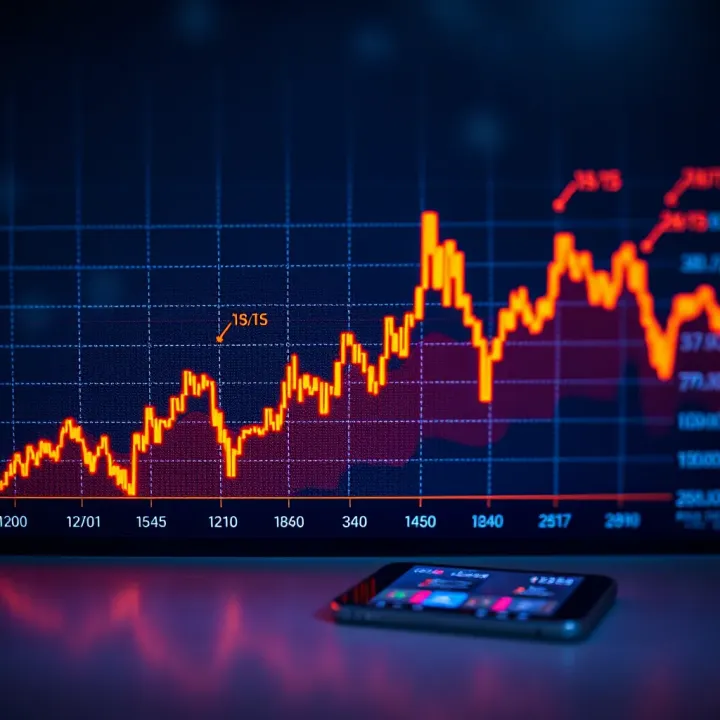
When to use line charts: Line charts work well for spotting overall trends over longer periods. If you're tracking NSE stocks or the KSh/USD forex rate for weeks or months, line charts help reveal steady movements or changes. However, they may miss intraday fluctuations, so they're less suited for day traders who need detailed price info.
Understanding open, high, low, close (OHLC): Bar charts display four price points per interval — opening price, highest price, lowest price, and closing price. This richer data shows how prices moved during the session. For instance, when trading the maize commodity market, knowing the daily highs and lows helps in understanding market volatility.
Advantages for intraday trading: Because bar charts offer intricate price details, they suit traders who buy and sell within the same day. Intraday traders watching forex pairs like KSh/EUR depend on bar charts to identify quick shifts and decide entry or exit points. This finely grained view supports faster decisions than line charts.
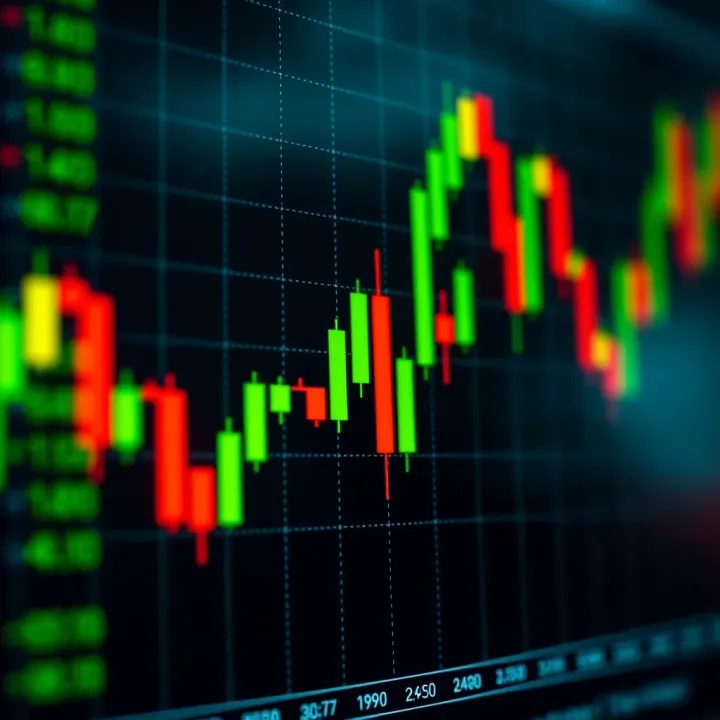
Anatomy of a candlestick: Each candlestick represents price movement during a chosen period, showing open, close, high, and low prices in a visually clear way. The body’s colour (usually green or red) indicates whether the price went up or down. Imagine tracking Equity Bank shares; candlesticks give a snapshot of sentiment at each trading session.
Common patterns relevant for Kenyan traders: Patterns like 'Doji' or 'Engulfing' signal possible trend changes. Recognising these can help you spot when the NSE market or forex pairs might reverse direction. For example, a bullish Engulfing pattern might suggest strong buying interest in a particular stock.
How candlesticks reveal market sentiment: Candlesticks don't just show numbers; they tell a story of buyer and seller strength. Long green candlesticks reveal strong buying, while long red ones point to strong selling pressure. It’s like watching a tug of war between bulls and bears. For commodity traders in Kenya, this insight helps decide whether to hold, buy more, or sell.
Choosing the right chart type lets you read the market’s pulse better and make informed trading decisions. Different charts serve different needs, so it’s wise to match your trading style and goals with the tool that makes the most sense.
Mastering how to read and interpret trading charts is essential for Kenyan traders seeking smart entry and exit points in any market. These charts paint a clear picture of price movement over time. By recognising trends, support zones, and signals from volume or indicators, traders can avoid guesswork and craft strategies backed by evidence.
A trend shows where the market is headed. An uptrend means prices generally rise over time, marked by higher highs and higher lows. This signals buyers have control, so traders often look to buy on dips during such periods. Conversely, a downtrend features lower highs and lower lows as sellers dominate. Selling or shorting opportunities arise here. When prices move sideways within a range, the market lacks clear direction. Recognising this helps traders avoid entering trades blindly and instead wait for a breakout.
For instance, if a stock listed on the Nairobi Securities Exchange (NSE) has stayed flat around KSh 150 to KSh 160 for weeks, it indicates a sideways market. Buying during this phase might be risky unless volume confirms a breakout.
Support is a price level where buying interest prevents further drops. Resistance stands where selling pressure caps price rises. Identifying these zones helps traders anticipate reversals or breakouts. In Kenya's forex markets, say the USD/KSh rate bounces back every time it hits KSh 110; that's a support level.
Spotting support and resistance saves you from chasing trends blindly, allowing for better stop-loss placements and profit targets. They illuminate key psychological price points shaped by local and international trader behaviour.
Volume reflects the number of trades or shares exchanged. High volume confirms price moves' strength, while low volume warns of weak or false signals. For example, if Safaricom shares jump sharply but trade on thin volume, the rally might lack follow-through.
Kenyan traders following agricultural commodity prices should watch volume to judge if a price move has genuine momentum or is just noise. Volume often precedes price changes, serving as an early warning.
Indicators blend price and volume data to highlight trends and reversals. Moving averages smooth out prices to define direction. The Relative Strength Index (RSI) shows if an asset is overbought or oversold, while MACD (Moving Average Convergence Divergence) signals trend changes.
These tools are popular because they add a layer of objectivity, helping Kenyan traders avoid emotional decisions. For instance, an NSE trader might wait for the MACD line to cross above its signal line before buying a stock.
Relying solely on one tool can mislead. No single indicator works perfectly in all markets or timeframes. Pairing multiple signals—such as combining RSI with volume and support zones—brings balance and reduces risk.
A forex trader using only moving averages may miss key reversals that RSI would catch. Diverse inputs safeguard against false alarms.
Short-term swings are often random noise, especially in volatile markets like forex or the NSE during earnings seasons. Knee-jerk reactions to these can erode profits.
Instead, Kenyan traders should focus on confirmed patterns over longer periods or wait for volume confirmation. Patience avoids costly mistakes from jumping every tick.
Reading charts effectively means seeing beyond the surface, using trends, volume, and indicators to understand market behaviour. Kenyan traders who master these can navigate both NSE and forex markets with much more confidence.
Choosing the right charting tools is vital for Kenyan traders who want to navigate local markets effectively. The tools you pick can influence how quickly and accurately you read price movements, spot opportunities, and manage risks across NSE (Nairobi Securities Exchange), forex, and commodities. Considering Kenya’s unique trading context—including payment preferences like M-Pesa and asset types common in the region—helps customise your trading set-up for better outcomes.
Many Kenyan traders prefer platforms that integrate easily with M-Pesa for depositing and withdrawing funds. This convenience reduces delays and high bank charges, especially for those trading forex or NSE stocks. Platforms such as ThinkMarkets and Etorox have mobile-friendly apps with direct M-Pesa payment options, making it simple to fund accounts anytime from anywhere, even when commuting in a matatu.
Having mobile access means you can respond swiftly to market changes during Kenyan trading hours or while monitoring foreign currency pairs involving the Kenyan shilling (KSh). This setup suits traders who juggle trading with other commitments and prefer to manage their portfolios on the go.
To make the most of trading charts, using platforms covering all relevant asset classes is key. Some systems focus solely on forex or commodities, while others offer NSE stocks alongside commodities like maize or coffee futures.
For example, MetaTrader 4 and TradingView cover a wide range of assets, including Kenyan equities, forex pairs like KSh/USD, and commodities especially relevant to Kenyan traders. This breadth allows you to switch easily between markets as opportunities arise. Access to local data feeds — such as NSE real-time quotes or agricultural commodity prices — keeps trade decisions grounded in Kenya’s economy.
Good charting tools let you adjust your timeframe, which can hugely impact your reading and trading approach. Day traders might focus on 5- or 15-minute charts to catch quick moves, while long-term investors look at weekly or monthly views for broader trends.
For Kenyan traders active in the NSE or forex, switching between timeframes helps find entry and exit points appropriate for market conditions. For instance, monitoring a 1-hour chart for intraday volatility while referencing a 1-month chart can provide perspective on overall market direction.
Customisable alerts let you stay ahead without staring at your screen all day. Set price alerts to get notified when NSE stocks hit specific targets or forex pairs breach certain levels. These notifications via SMS or app push alerts help traders act quickly, especially in volatile sessions.
Annotations also let you mark support levels, resistance zones, or note particular patterns like head and shoulders, tailored to your trading style. Over time, these notes can help you track your strategy’s performance and learn from past decisions, refining your approach to Kenyan market nuances.
Selecting a charting tool that fits your trading routine, local payment options, and market focus makes your trading more efficient and responsive. The right choice saves time, cuts costs, and sharpens your market edge on the NSE, forex markets, or commodity trades.
Trading charts are a critical tool for Kenyan traders across various markets, providing a clear visual guide to price movements that may otherwise be difficult to track. In the context of NSE stock trading, forex, and commodity markets, charts help traders make timely and informed decisions, which is crucial given the dynamic nature of these markets. Real-life application involves more than just looking at the graphs — it means interpreting them with the local economic climate, market news, and trading volumes in mind.
Timing buy and sell decisions is one of the core benefits of using trading charts on stocks listed at the Nairobi Securities Exchange (NSE). Kenyan traders can study price trends, moving averages, and volume changes to identify when stocks like Safaricom, Equity Bank, or KCB are showing signs of strength or weakness. For instance, a rising moving average combined with increasing trade volumes could signal a buying opportunity, especially when the stock price pulls back to a support level.
Spotting breakout opportunities is equally vital in NSE trading. Breakouts happen when a stock price moves above a resistance level or below support, signaling a potential strong move either upwards or downwards. Kenyan traders keen on capitalising can use such signals to enter trades shortly after confirming a breakout, often leading to profitable moments when the market moves swiftly. For example, when a stock like Bamburi Cement breaks above a long-standing resistance, this might suggest an increased demand driven by local construction activities.
When dealing with forex pairs that include the Kenyan Shilling (KSh), such as KSh/USD or KSh/EUR, charts help traders spot trends and react to economic data like CBK announcements or trade balances. Understanding how the KSh moves against major currencies via technical analysis allows traders to time their entries and exits better, reducing guesswork in a market heavily influenced by global and local factors.
Managing risks with technical signals is crucial, especially in forex trading where volatility can spike suddenly. Tools like stop-loss orders based on chart support levels or indicators such as the Relative Strength Index (RSI) help traders limit losses and protect profits. For instance, if a forex trader sees RSI crossing into the overbought region for KSh/USD, this can serve as a warning to tighten stops or consider taking profits.
Kenyan traders involved in commodities such as tea, coffee, or maize can greatly benefit from tracking price movements through charts. By observing historical trends and volume shifts, they can anticipate seasonal price swings or the impact of supply chain disruptions, which often relate to harvesting periods or export demand.
How charts help in speculation and hedging is particularly relevant for farmers, exporters, and commodity dealers in Kenya. For speculators, charts provide entry points to buy low and sell high, while hedgers use the same to protect against price drops. A tea exporter, for instance, might use futures price charts to decide when to lock in rates and reduce exposure to volatile global market prices.
Practical use of trading charts in Kenya requires merging technical knowledge with awareness of local market forces. Combining chart insights with news on government policies, weather conditions affecting crops, or forex reserves gives traders a balanced view for smarter decisions.
This hands-on approach makes charts more than numbers and lines — they become a compass for navigating Kenya’s diverse trading landscape effectively.
Explore Deriv trading in Kenya 📈 - learn how to trade forex, commodities & indices safely, master strategies, manage risks, and make smart investment choices.

Explore binary trading in Kenya 🇰🇪 with insights on basics, legal rules, top platforms, risks, and smart strategies to trade wisely and avoid mistakes.
Explore Deriv binary trading 📊 with essential tips, strategies, and platform features. Learn risk management and regulations for Kenya traders 🇰🇪 today!

🤖 Explore how forex bot trading works in Kenya, its pros, risks, and tips on choosing and managing automated systems for smarter trading decisions.
Based on 5 reviews