

Trading Bots in Finance: How Automated Systems Work
🤖 Discover how trading bots automate financial trades using strategies for speed and precision. Vital insights for Kenyan traders on benefits, risks, and types.
Edited By
Edward Thompson
The Volatility Index, often called VIX, is a crucial gauge for anyone involved in trading or investing. It measures the market’s expectation of volatility—how much prices might swing over the short term—based on option prices of major stock indexes. Simply put, it’s a barometer of fear or calm in the financial markets.
For Kenyan investors eyeing global markets or local equities, understanding the VIX helps anticipate market moods and manage risk better. When the VIX rises sharply, it signals increased uncertainty or risk; prices might fluctuate widely. Conversely, a low VIX suggests steady markets with less expected price movement.
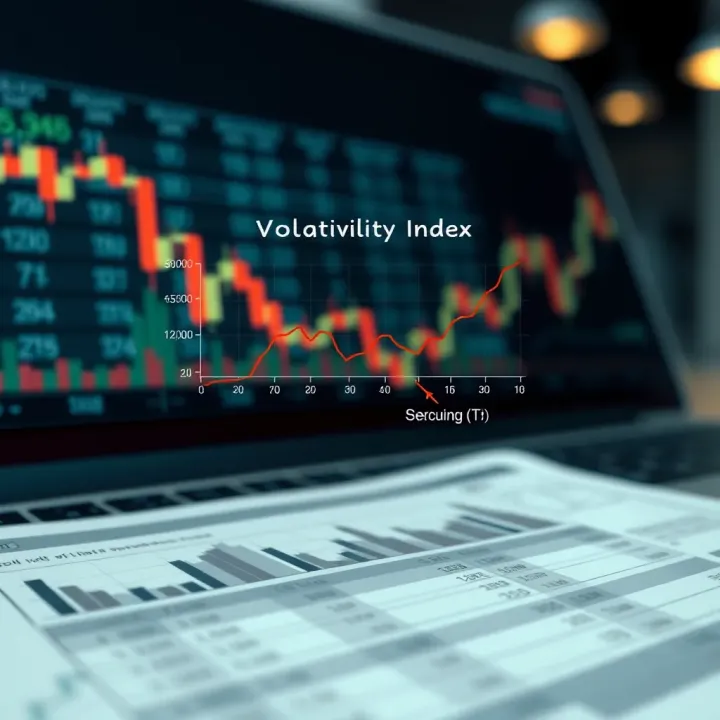
Volatility impacts investment decisions in several ways:
Risk assessment: High volatility means higher risk, informing decisions on asset allocation or hedging.
Timing trades: Traders often watch the VIX to spot entry and exit points.
Portfolio management: Knowing the expected market swings helps in balancing exposures and protecting gains.
The VIX is calculated using prices of options on the S&P 500 index—these are contracts giving the right to buy or sell stocks at certain prices. Since options prices reflect trader expectations of future volatility, the VIX distils this information into a single number representing expected fluctuations over the next 30 days.
While the VIX itself focuses on the US market, similar indexes exist globally, influencing decisions on regional assets. For Kenyan investors, tracking the VIX alongside local market indicators can give a fuller picture of worldwide risk dynamics.
Volatility isn’t just about big price drops or jumps—it’s about the unpredictability of returns over a given period. Understanding this helps investors avoid surprises and plan better.
Recognising how the VIX works and what it signals enables more informed decisions in trading, investment, and even risk management. Next, we will explore how to interpret the VIX movements and apply these insights practically in Kenyan financial markets.
At its core, the volatility index measures the market’s expectation of price fluctuations over a set period, usually 30 days. Unlike simple price charts that show past performance, this index captures anticipated swings in the market, providing a forward-looking gauge of risk. For investors and traders, knowing how much the market expects prices to move helps in making decisions about timing, position sizing, and hedging.
A practical way to think about the volatility index is as a "fear gauge." When the index is low, markets generally feel stable; high values suggest heightened uncertainty or anxiety among investors. For example, during the 2008 global financial crisis, the VIX — a popular volatility index based on the S&P 500 — soared past 80 points, signalling intense panic. This made many investors either tighten their portfolios or seek protective strategies.
Common volatility indices like the VIX are benchmark tools worldwide. The VIX specifically tracks expected volatility through option prices on the S&P 500, giving a snapshot of risk in major US equities. Similar indices exist for other regions and asset classes, such as the Euro Stoxx 50 or emerging markets. While Kenya does not have a widely publicised local volatility index, international benchmarks like the VIX serve as reference points for Kenyan investors exposed to global markets.
Volatility and risk go hand in hand: higher volatility usually means greater risk. When price swings widen, asset values can drop suddenly, making investment returns more unpredictable. This instability poses challenges, especially for risk-averse investors or those with short-term goals. Therefore, understanding volatility helps investors balance potential rewards against risks appropriately.
For instance, an investor holding shares in a volatile NSE stock like Safaricom may notice periods where price jumps or falls are sharp and frequent, reflecting underlying economic news or market sentiment. Using volatility data, one can anticipate such uncertain periods and adjust investment exposure accordingly.
The implications of volatility reach beyond mere measurement. Investors and traders often use the volatility index to manage expectations and craft strategies. For example, a rising volatility index might prompt a trader to reduce exposure to risky assets or enter hedging positions using options. Conversely, a falling index may encourage a more aggressive stance, taking advantage of calmer markets. However, reliance purely on volatility to time the market can be risky; it should be combined with other analysis methods.
The volatility index offers a practical lens through which to view market mood and tailor investment decisions, helping to guard against unexpected shocks and improve portfolio resilience.
In summary, the volatility index reflects how much price movement investors expect and shows prevailing market uncertainty. It’s an essential tool, whether managing risk or spotting shifts in market sentiment, especially for those engaging with local and international financial markets.
Understanding how the volatility index is calculated is key to appreciating its value in financial markets. The index quantifies expected market fluctuations, relying on precise market data inputs and mathematical methods. This calculation helps traders, investors, and analysts gauge potential price swings and adjust their risk strategies accordingly.
The volatility index primarily depends on the prices of options—financial contracts granting the right to buy or sell assets at certain prices within specified periods. These option prices reflect investor expectations about how much the market might move. Key here are both call and put options across a range of strike prices and expiry dates, which together form the basis for estimating the overall market’s anticipated volatility.
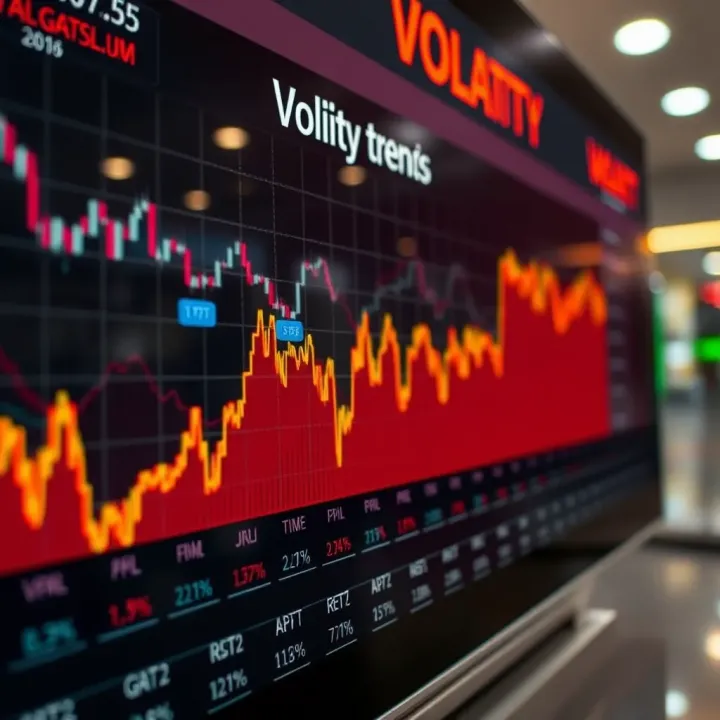
For example, the VIX index, referencing the US S&P 500 market, uses options expiring in about 30 days. Using these nearly-term options allows the index to capture short-term market sentiment. Similarly, Kenyan investors watching NSE equities can consider options data (where available) to infer local market mood, though such instruments are less common locally.
Implied volatility is a market-driven estimate of how volatile the underlying asset should be over an option’s lifetime. Unlike historical volatility, which looks back at past price movements, implied volatility pulls from current option prices to predict future fluctuations. This forward-looking measure is essential for the volatility index, as it reflects expectations rather than past events.
Investors benefit from implied volatility by understanding potential price swings to anticipate risk. For instance, a sudden rise in implied volatility generally signals increased uncertainty or fear in the market, prompting cautious trading or hedging strategies.
Calculating the volatility index uses a formula that integrates weighted prices of multiple options at varying strike prices and expiry dates. The method involves complex steps like interpolating between option maturities and using the option's midpoint between bid and ask prices. The final output is an annualised percentage indicating expected market volatility over a set period, commonly 30 days.
This mathematical approach helps smooth out noise from any single option price, providing a more stable indicator. Although the formula is technical, its practical benefit is clear: it transforms individual, potentially erratic option prices into a summarised, digestible figure representing market fear or calm.
The volatility index updates in real-time or near real-time during market hours, reflecting the latest option prices and market conditions. This frequent updating lets investors track sudden shifts in sentiment—say, during political events or economic announcements that move markets quickly.
For local traders in Kenya, keeping an eye on NSE market data and global indices like the VIX offers timely clues on volatility trends both at home and internationally. Rapid updates mean portfolios can be adjusted quickly to respond to risk signals, which is crucial in fast-moving markets.
Real-time data and rigorous calculation methods make the volatility index a practical tool for monitoring market sentiment and managing risks effectively.
Together, these calculation elements form the backbone of the volatility index’s usefulness, turning complex option market inputs into a straightforward risk gauge for investors and traders.
The Volatility Index gives investors a quick snapshot of the market’s mood, especially how much uncertainty or fear is hanging around. For traders and investors, understanding this index can help make better decisions on when to step in or step back. It’s not just about numbers on a screen but about real insights into market behaviour.
When the Volatility Index shoots up suddenly, it usually signals increased nervousness among investors. For example, during political unrest or unexpected economic data releases in Kenya, the index tends to jump, reflecting fear of market drops. On the flip side, a low or declining volatility index suggests calmer markets where investors feel more confident and price swings are less extreme.
This reading is practical for investors who want to understand whether the market is likely to be choppy or steady. For instance, after the announcement of Kenya’s GDP growth figures or during election periods, watching the index’s behaviour helps anticipate market reactions rather than relying only on past price trends.
When volatility is high, many investors become cautious, often pulling away from risky assets or demanding higher returns for the additional risk. This shift can increase market swings as selling pressure rises. Conversely, when the index is low, some investors might feel comfortable buying more, pushing prices up.
In Kenya’s NSE, for example, foreign investors might reduce their stakes if the volatility index spikes due to regional uncertainty, shifting funds to safer assets or foreign markets. This behavioural pattern means the index indirectly influences liquidity and price movement, making it valuable for anyone placing money in the market to follow.
Investors can use volatility figures to decide when to hedge their portfolios. If the Volatility Index indicates rising market fear, they might buy options or invest in products that gain value during market declines. This helps cushion losses when share prices tumble.
For example, a trader with a sizeable holding in Safaricom shares might buy put options as a form of insurance if the volatility index starts climbing sharply. This strategy, while costing some premium, reduces potential losses during turbulent times.
Beyond hedging, the index also helps in reshaping one’s investment mix. When volatility rises, it may be wise to shift some funds from equities into safer assets like government bonds or money market instruments. This limits exposure to swings that might come with riskier stocks.
A Kenyan investor could, for instance, reduce holdings in cyclical companies on NSE and increase exposure in fixed income when the Volatility Index signals heightened uncertainty. Such timely adjustments protect capital and keep portfolios balanced according to changing market moods.
The Volatility Index doesn’t just measure market noise; it guides practical action on risk, helping investors protect and grow wealth sensibly.
Understanding and watching this index offers a clearer edge in the often unpredictable market, particularly in the Kenyan and East African financial scenes where local and global events can suddenly shift investor sentiment.
Understanding trading and investment strategies that involve volatility gives investors and traders additional tools to manage risk and capture opportunities in unsettled markets. Volatility often signals shifts in market sentiment, which can be exploited through specific financial products or timing methods. Kenyan investors can benefit by integrating these approaches alongside traditional stock and bond investments, especially when economic or political events stir price fluctuations.
Futures and options on the volatility index provide a direct way to speculate on or hedge against changes in market turbulence. These derivatives allow investors to buy or sell contracts based on the expected future level of volatility, not just the price of stocks or indices. For example, a trader expecting increased volatility around a Kenyan election might purchase VIX futures or options as a hedge. Although these products originate in markets like the USA, the concept is useful globally, including the NSE, where similar instruments may develop.
Exchange-traded funds (ETFs) related to volatility offer a more accessible entry point for those without direct access to futures or options markets. These ETFs track the performance of volatility indices or related derivatives, letting investors gain exposure to market fear or calm without complex trades. In Kenya, this could mean using international volatility ETFs accessible through brokerage platforms. Such funds provide liquidity and flexibility for portfolio diversification, especially during times when the NSE experiences wide price swings due to external shocks.
Using volatility to identify market entry and exit points is popular among traders seeking to buy when uncertainty is low and sell when fear peaks. For example, a drop in the volatility index might indicate calmer markets, signalling a good time to invest, while a spike could prompt profit-taking or increased caution. This approach helps traders position themselves ahead of market moves, reducing the chances of buying at a peak or selling at a trough.
Timing the market based solely on volatility is tempting but requires caution and experience.
That said, relying only on volatility to time trades carries significant risks. Volatility spikes can be sudden and short-lived, and markets often behave unpredictably during crises. Moreover, other factors like earnings reports, macroeconomic data, or political developments also influence price directions. Over-trading based on volatility signals might increase transaction costs or lead to emotional decisions. It's best used alongside other analysis tools and within a well-planned investment strategy to avoid costly mistakes.
In summary, trading and investment strategies involving volatility offer unique advantages but need a clear understanding and disciplined application. Kenyan investors who leverage these tools prudently can better navigate market ups and downs and protect their investments from shocks.
Applying volatility concepts to the Nairobi Securities Exchange (NSE) stocks helps local investors better understand price swings and market sentiment. Unlike developed markets with deeper liquidity, NSE stocks often experience sharper moves due to lower volumes and concentrated ownership. Tracking volatility indicators allows traders to anticipate periods of higher risk or opportunity. For example, during earnings season or after significant corporate actions like divestments, volatility tends to spike, signalling caution or chance for speculative gains.
Besides traditional analysis, using volatility insights aids portfolio construction to match the risk appetite and market conditions. Investors in Kenya can avoid panic selling if they grasp that occasional volatility spikes are normal rather than an immediate crash. This practical application of volatility helps foster more measured decision-making among local market participants.
Local instruments measuring market volatility are still developing, but some products already serve this purpose. For instance, Kenya’s NSE has started offering futures contracts on major stocks, which indirectly reflect volatility expectations. Also, volatility-related exchange-traded funds (ETFs) are gradually entering the region, though they remain limited compared to global markets. These instruments provide practical tools for hedging or speculating on volatility movements, a useful addition for risk management in Kenya’s jua kali investment world.
Moreover, financial technology platforms in Kenya increasingly provide implied volatility data for popular stocks, enabling retail investors to access more sophisticated metrics. This helps level the playing field and encourages wider adoption of volatility-based strategies in trading and investment.
Kenya and the wider East African region frequently experience market volatility influenced by political and economic events. For example, general elections often trigger uncertainty on the NSE as investors factor in possible policy changes or instability. The 2017 general elections saw a notable volatility surge followed by sharp corrections once results were clearer. Similarly, fluctuations in foreign exchange rates, especially the Kenya shilling moving against the US dollar, affect importers, exporters, and ultimately listed companies’ earnings, contributing to volatility.
Regional events like political unrest in neighbouring countries or changes in trade agreements within the East African Community also ripple through local markets. Such incidents often cause sudden shifts in market confidence, reflected in volatility spikes. Investors need to monitor these macro factors closely to anticipate potential market adjustments.
Adapting investment strategies to this reality involves staying alert to event calendars and understanding the typical market reactions. For instance, during election cycles, reducing exposure to highly cyclical stocks or increasing holdings in stable sectors like telecommunications can cushion portfolios from excessive swings. Also, using derivative instruments if available to hedge against volatility spikes may protect long-term gains.
Investors should remember that while volatility often brings uncertainty, it also creates opportunities for those prepared to manage risk wisely. This dual nature makes the volatility index an increasingly valuable tool in Kenya’s growing financial markets.
Monitoring volatility and responding to local economic and political developments can transform how Kenyan investors protect and grow their investments.
Volatility helps signal when NSE stocks are more likely to move suddenly
Limited but growing local instruments make volatility trading viable
Elections and currency moves remain common triggers for volatility
Adaptive strategies around volatility improve resilience and returns
In summary, the volatility index's role in Kenya and East Africa goes beyond a mere technical measure; it reflects the market’s heartbeat amid unique regional challenges and opportunities.
🤖 Discover how trading bots automate financial trades using strategies for speed and precision. Vital insights for Kenyan traders on benefits, risks, and types.

📊 Discover how binary trading bots work, their benefits, risks, and tips for Kenyan traders to automate and improve their binary options strategy effectively.

Explore how AI trading bots operate and impact Kenya's financial markets 🤖📈. Learn benefits, risks, ethical tips, and practical advice for using AI in trading.

🔍 Explore the vital role of traders in Kenya's economy, their skills, regulations, challenges, and how tech like M-Pesa reshapes trading opportunities locally.
Based on 5 reviews