
How to Use TradingView Charts for Smarter Trading
📊 Master TradingView charts to analyse forex, stocks, and cryptocurrencies. Learn to customise, use indicators, and make savvy trades tailored for Kenyan market needs.
Edited By
Joshua Reynolds
TradingView.com has become a popular go-to for traders and investors globally, including here in Kenya. Its charting tools offer a powerful way to analyse markets, spot trends, and make informed decisions. Whether you invest in NSE stocks, forex, cryptocurrencies, or commodities, understanding how to navigate these charts will sharpen your market insight.
The platform combines real-time data and a user-friendly interface that allows you to access different types of charts, technical indicators, and drawing tools—all from your desktop or mobile device. For Kenyan traders, TradingView's versatility means you can track both global markets and local ones like NSE (Nairobi Securities Exchange), all on one platform.
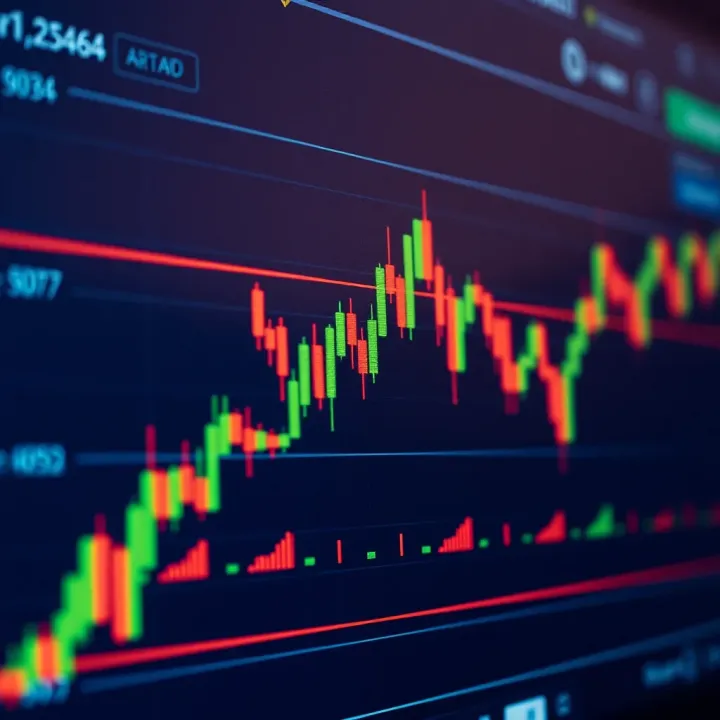
To start, it’s important to familiarise yourself with the main charting layout. The price chart is front and centre, showing price movements over time. You will find basic options like candle charts, line charts, and bar charts to suit various trading styles. You can also add indicators such as Moving Averages, RSI (Relative Strength Index), and Bollinger Bands to enhance your analysis.
Customising charts to fit your specific trading strategy improves your ability to make precise calls—whether you’re a short-term trader watching intraday movements or a long-term investor following broader market trends.
Keep an eye on these core features as you get started:
Chart Types: Candlesticks are popular for their detailed price action, but you can switch to Heikin Ashi or Renko for different insights.
Time Frames: Choose from one-minute to monthly views to match your analysis horizon.
Indicators: Add multiple tools for momentum, trend, and volume to build your trading setup.
Drawing Tools: Mark support/resistance zones, trendlines, and patterns to spot opportunities.
This introduction lays the groundwork for making TradingView.com charts a practical asset in your trading toolbox. Next, we’ll explore specific features and how you can tailor them to fit your market approach seamlessly.
TradingView.com is one of the most accessible and feature-rich platforms for market analysis, offering charts that suit both beginners and seasoned traders. Understanding its core features and how to navigate its interface helps anyone interested in tracking stocks, forex, commodities, or cryptocurrencies with greater confidence and precision. This section sets the stage for effective use by highlighting what the platform offers and how Kenyan traders can tap into its resources.
TradingView provides a comprehensive environment combining real-time market data and a variety of technical analysis tools. Traders benefit from various chart types like candlesticks and lines, plus an extensive library of technical indicators. Kenyan investors can monitor multiple asset classes, enabling decisions across different markets in one place. This all-in-one capability avoids the need to jump between websites or pay for expensive charting software.
The platform is browser-based but also offers mobile apps for Android and iOS, making it easy to follow market trends even when moving around. This is practical for Kenyan users who rely heavily on mobile internet; whether on a laptop in a Nairobi café or a smartphone commuting in a matatu, TradingView keeps users connected. All charts load quickly, and settings sync automatically between devices, ensuring the continuity of analysis.
Kenyan traders have gravitated towards TradingView because of its low barrier to entry and comprehensive data coverage, including NSE (Nairobi Securities Exchange) stocks. The platform supports integration with local tech ecosystems, such as making market alerts visible on mobile and via email. Plus, its community features let users learn from others, share ideas, and pick strategies that align with Kenya’s growing investor base.
The chart screen centres on the price graph, where live market action unfolds. You’ll find price bars or candles plotted against time on the x-axis, with prices on the y-axis. Surrounding this are key elements: the watchlist for quick checks of your favourite assets, the indicator menu for technical tools, and data panels for volume or other metrics. This layout supports rapid analysis without clutter.
Finding specific stocks or forex pairs is straightforward using the search box atop the interface. Typing “NSE” followed by the company code, like "NSE Safaricom", brings up local stocks instantly. For forex, entering currency pairs like “USD/KES” pulls up current quotations. This saves time and helps focus on markets relevant to your trading or investment interests.
The toolbar on the left side provides easy access to drawing tools such as trendlines and Fibonacci retracements, essential for spotting patterns and support or resistance zones. Panels at the bottom hold information on volume, news, and alert settings. Kenyan traders can customise these features to track market moves that matter most, helping to react faster and more decisively.
Familiarising yourself with TradingView’s layout is not just about knowing where things are; it’s about making the platform work for your individual style and goals. This understanding is key to turning data into actionable market insights.
TradingView offers several chart types, each suited to different trading styles and market conditions. Choosing the right chart type can greatly improve how you read market trends and make decisions. Understanding the differences helps you avoid confusion and pick the best tools for your strategy.
Candlestick Charts stand out as one of the most popular options. They show open, high, low, and close prices within specific time intervals, forming patterns that signal market sentiment. For example, a Kenyan forex trader looking to catch entry points on the USD/KES pair often relies on candlestick formations like 'hammer' or 'doji' to judge potential reversals.
Line Charts distill price movement into a continuous line connecting closing prices over time. This simplicity helps investors quickly identify overall trends without the noise of intraday fluctuations. A long-term stock investor in the NSE 20 Index might use line charts to see if prices are generally trending upward or downward over months.
Bar Charts break down price action like candlesticks but use bars instead of filled bodies. Each bar displays the range and closing price for the period. Traders who prefer cleaner visual cues sometimes favour bar charts, especially when assessing volatility on commodities or cryptocurrencies. For instance, a trader in Bitcoin might pick bar charts to closely watch daily price swings.
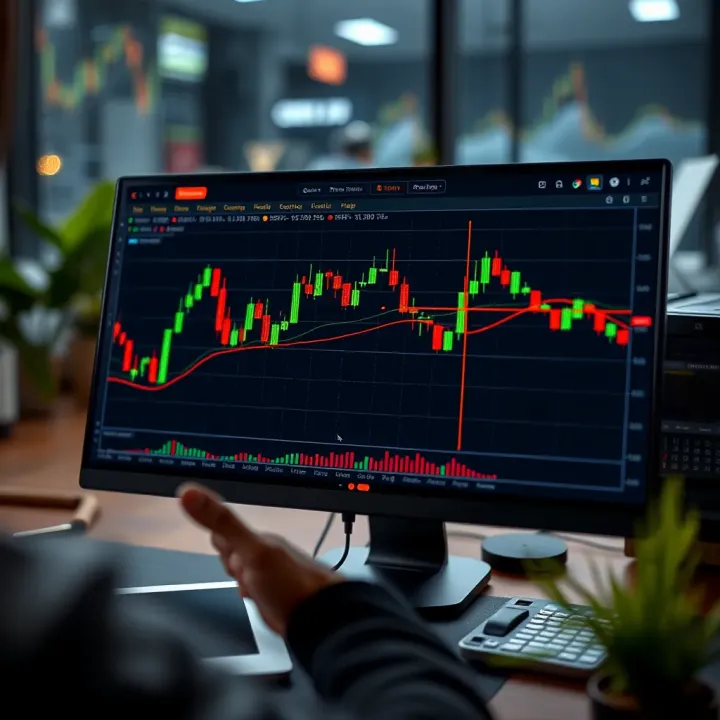
Renko and Heikin Ashi charts smooth out market noise to highlight trends clearly. Renko charts use fixed price movements to form bricks, ignoring time, which suits traders wanting clear entry and exit signals amid volatile markets. Meanwhile, Heikin Ashi averages price data to produce smoother trends, helping traders distinguish between strong and weak trends. Kenyan day traders might find these charts helpful for quick decision-making during fast market moves.
Short-Term Versus Long-Term Trading demands different chart views. Short-term traders often rely on candlestick or Heikin Ashi charts for detailed price action and quick signals. Conversely, long-term investors might prefer line charts for clearer trend analysis across weeks or months.
Chart Types and Market Volatility interact closely. During high volatility, Renko or Heikin Ashi charts help filter noise and avoid false signals. On calmer markets, line or bar charts might provide enough detail without overwhelming the trader.
Applying Charts to Forex, Stocks, and Cryptocurrency varies slightly. Forex and crypto markets benefit from candlestick and Renko charts due to their 24-hour trading and volatility. Stock traders might use more bar or line charts, especially when analysing daily or weekly data on exchanges like NSE or BVC.
Selecting the right chart is about matching the tool to your trading timeframe, market type, and personal style. Experiment to find what fits your decisions best.
By knowing these chart types and how they work, Kenyan traders and investors can tailor their market analysis more effectively on TradingView, gaining an edge in their trades and investments.
Using technical indicators and drawing tools on TradingView charts helps traders identify trends, potential entry and exit points, and overall market sentiment. These are essential for analysing price movements objectively instead of relying on guesswork. For Kenyan traders who may face volatile markets or limited access to timely news, these tools level the playing field by providing visual clues grounded in price action.
Moving Averages (MAs) smooth out price data to reveal the direction of a trend. The two most common types are the Simple Moving Average (SMA) and the Exponential Moving Average (EMA). Traders often use MAs to determine support and resistance levels or to spot trend reversals. For example, a Kenyan investor tracking Safaricom shares might watch the 50-day and 200-day MAs for crossovers that suggest a change from bullish to bearish momentum.
The Relative Strength Index (RSI) measures speed and change of price movements to show overbought or oversold conditions. RSI values above 70 might indicate an asset is overbought and ripe for a correction, while readings below 30 suggest oversold conditions and a possible bounce. Using RSI together with MAs gives clearer timing signals.
The Moving Average Convergence Divergence (MACD) indicator highlights momentum changes by comparing two EMAs and their difference (signal line). When the MACD line crosses above the signal line, it points to bullish momentum; a cross below indicates bearish momentum. This is helpful for Kenyan forex traders deciding when to enter or exit Jumia Kenya’s stock or currency pairs like USD/KES.
Bollinger Bands plot price volatility as an envelope around the price chart, formed by a moving average plus and minus standard deviation. When the bands tighten, it signals low volatility that often precedes a breakout. Wide bands suggest high volatility. Traders can use Bollinger Bands to monitor volatility around popular NSE stocks or even cryptocurrencies.
Volume indicators track the number of shares or contracts traded during a period. Volume spikes can confirm price movements, adding weight to breakouts or trend reversals. For instance, if Equity Bank shares surge on high volume, it suggests genuine buying interest instead of a retracement. TradingView provides volume histograms and on-balance volume (OBV), which both help verify the strength behind price moves.
Drawing trendlines helps you connect price lows or highs to identify the direction and strength of a trend. Support and resistance lines mark price levels where buying or selling pressure has historically appeared. Kenyan traders often draw horizontal lines at key levels where prices reversed previously, like the all-time high of KCB shares. These tools aid in anticipating areas where price may pause or reverse.
Fibonacci retracement is a popular technique that uses horizontal lines based on key Fibonacci ratios (23.6%, 38.2%, 50%, 61.8%) drawn between a significant price high and low. These levels suggest where prices might pull back before resuming the trend. For example, if a Nairobi-based trader watches the NSE 20 Share Index and notices a retracement to the 61.8% level followed by consolidation, it might signal a buying opportunity.
Annotating charts allows traders to record thoughts, mark entry and exit points, or flag unusual patterns. This is useful if you want to review past trades or prepare for market discussions with colleagues. In a Kenyan context, a trader might note when a company reports earnings or when the CBK announces monetary policy changes right on the chart for quick reference.
Technical indicators and drawing tools on TradingView are not just fancy gadgets; they offer practical ways to interpret price behaviour and forecast market moves, especially with local nuances in mind.
These tools, when combined skillfully, sharpen your market analysis and help in making more informed trading decisions across stocks, forex, and crypto markets familiar to Kenyan investors.
Customising your charts on TradingView is a vital step towards making market analysis more efficient and tailored to your specific needs. Each trader or investor has a unique style and strategy, so adjusting chart settings—like timeframes, colours, and layouts—helps bring clarity and focus to the data. A personalised chart reduces clutter and speeds up decision-making, especially when Kenya’s markets can be quite volatile, requiring quick, informed actions.
Additionally, saving your chart settings and templates prevents you from recreating configurations every time you log into TradingView. This saves time and ensures consistency, helping you track market trends or move in and out of positions with confidence. Saving charts also allows you to experiment with different approaches without losing your baseline setup.
Switching between time intervals on charts is fundamental for gaining different perspectives on the market. For instance, a trader focusing on intraday moves may prefer 5-minute or 15-minute intervals, while a long-term investor might use daily or weekly charts. Being able to toggle quickly between these views on TradingView means you can spot short-term market fluctuations or confirm longer-term trends without leaving the platform.
In practice, a forex trader monitoring EUR/USD might check a 1-hour chart for entry points but switch to a daily chart to understand the broader trend. This flexibility helps you avoid being trapped in short-term market noise and informs better trade timing.
TradingView allows opening multiple charts side-by-side, which is handy for comparing different assets or different timeframes simultaneously. This feature is especially useful for Kenyan traders who follow multiple markets, such as NSE equities, forex pairs, and cryptocurrencies like Bitcoin.
For example, a trader might have one chart showing Safaricom shares on a daily interval and another displaying the EUR/KES forex pair on a 30-minute chart. Comparing these side-by-side can reveal correlations or divergences that influence trading decisions. This method helps save time and prevents the jigsaw puzzle feeling of flipping endlessly through tabs.
Once you’ve adjusted indicators, timeframes, or colour schemes, saving these settings as a template makes your workflow more efficient. TradingView lets you save different templates for various strategies—for instance, one template with moving averages and RSI for trend trading, and another with Bollinger Bands and MACD for swing trading.
This feature means you don’t have to rebuild your setup from scratch each trading day. After saving, applying templates is just a click away, helping you move quickly when market conditions shift, such as during news releases or economic data outturns.
Setting alerts on TradingView is a practical way to monitor key price levels or indicator signals without staring at your screen all day. You can configure alerts to notify you via email, pop-ups, or phone notifications whenever a stock hits a certain price or an indicator crosses a threshold.
For example, if you’re watching Safaricom’s price and want to know when it breaks a resistance level, you can set an alert at that price point. Alerts help Kenyan traders stay alert amidst busy schedules or while travelling, avoiding missed opportunities in fast-moving markets.
Customising and saving your charts, plus setting timely alerts, not only make your trading smarter but also help you manage risks better by keeping you informed exactly when it matters.
Sharing and collaborating using TradingView charts enhances how traders and investors work together, learn, and make decisions. Especially in Kenya's diverse market where many investors seek peer insights, being able to exchange chart setups and ideas on one platform broadens perspectives. It helps reduce guesswork and sharpens analysis by getting feedback from skilled traders and analysts. Plus, sharing charts is essential when you want to explain your ideas clearly, whether to a mentor, a client, or in an investment group.
TradingView allows you to create direct links to your chart setups. This makes sharing your exact analysis simple and fast. Suppose you notice a promising pattern in Safaricom shares and want to share it with a colleague via WhatsApp or email; just generate a chart link and send it. The recipient will see your customised chart view instantly without needing to recreate it.
This feature saves time and reduces confusion when discussing market moves or strategies. Kenyan traders frequently use it in WhatsApp groups or forums dedicated to stocks or forex to back up their calls with visual data.
Beyond private sharing, you can publish your charts to TradingView’s public community. When you do this, anyone on the platform can view, comment, and rate your analysis. This tool works well if you're looking for diverse opinions or want to showcase your skills to potential clients or followers.
Publishing also gives you a chance to learn by seeing how the community reacts to your setups. For example, if your chart predicting the movement of the NSE 20 index gets constructive criticism, you can adjust your method accordingly. It builds a sense of accountability and hones your market expertise over time.
TradingView hosts numerous public chat rooms and groups where traders discuss specific markets, strategies, or regional dynamics. For a Kenyan trader interested in forex, joining a Forex Kenya group on TradingView opens up opportunities to ask questions, share tips, and get real-time insights on currency pairs involving the shilling.
Engaging in these groups helps you stay updated with market movements and connects you with a community facing similar market challenges. The back-and-forth nature of chats mimics lively conversations you’d have in a trading hub or a busy trading floor.
Another advantage of TradingView’s social features is the ability to follow seasoned traders and market analysts. By doing so, your feed regularly shows their published charts, market comments, and trading ideas.
Learning from veterans who have tested strategies across various market conditions can save you years of trial and error. For instance, when a respected Kenya-based forex analyst posts a chart with insights on KSh/USD trends, you gain immediate, actionable information that may influence your trades.
Sharing and collaboration turn TradingView from just a charting tool into a lively, interactive platform, helping Kenyan traders make smarter, community-validated decisions.
By mastering these sharing and social tools, you position yourself within a network that nurtures knowledge and can improve your trading outcomes significantly.
📊 Master TradingView charts to analyse forex, stocks, and cryptocurrencies. Learn to customise, use indicators, and make savvy trades tailored for Kenyan market needs.
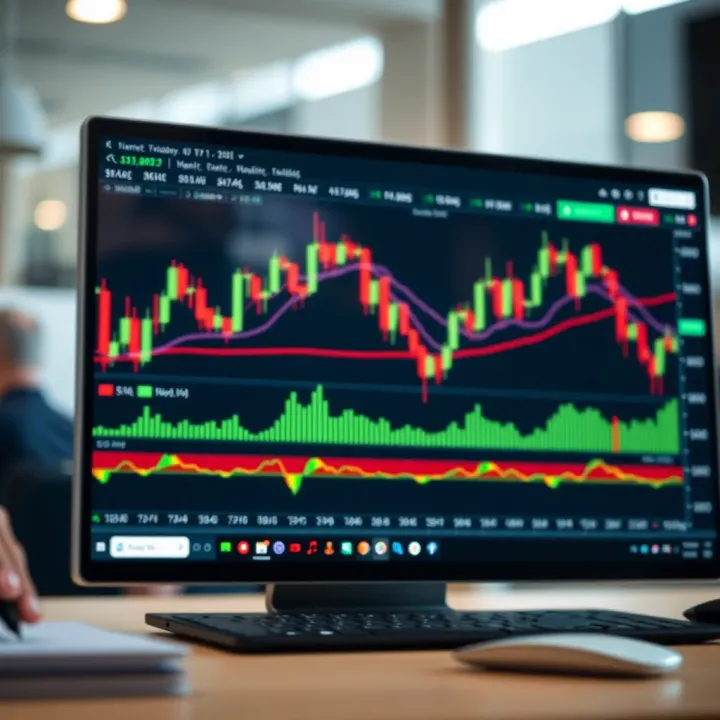
📈 Learn how Kenyan traders can use TradingView.com for real-time charting, market analysis, crypto tracking, and connecting with fellow investors. Trade smarter!
📈 Discover how Kenyan traders can boost binary options trading using TradingView's smart charts, broker links, and solid risk management tactics!
📈 Master binary options trading with TradingView charts! Learn to analyze trends, use key indicators, and manage risks for smarter trades in Kenya 🇰🇪.
Based on 8 reviews