
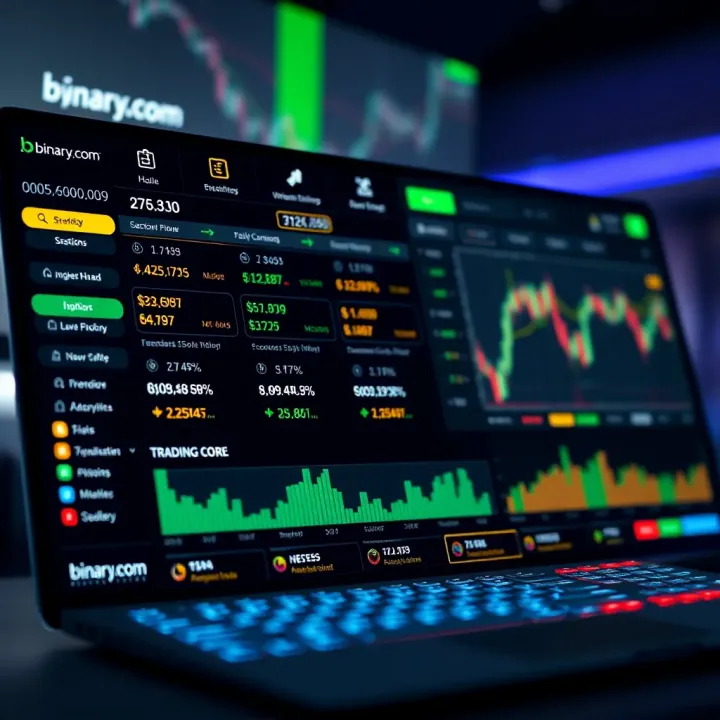
Understanding Binary.com for Kenyan Traders
Explore how Kenyan traders can safely navigate Binary.com with insights on account types, trading options, platform features, and security measures 📈🇰🇪
Edited By
Isabella Turner
SmartCharts on Binary.com offer Kenyan traders a powerful way to track market movements and make smarter trading choices. These charts go beyond the basics, enabling you to analyse various assets — including forex, commodities, stocks, and indices — with a range of technical tools right at your fingertips.
Unlike simple price graphs, SmartCharts combine interactive features with advanced analysis options. This allows you to spot opportunities, confirm trends, and manage risks better. For instance, you can adjust timeframes, overlay indicators like moving averages or RSI, and even draw trendlines directly on the chart, making your trading approach more precise.

For traders in Kenya, this matters a lot. Markets can be volatile, and quick but informed decisions are key. Being able to customise charts based on your strategy—whether day trading the US dollar against the shilling or following gold prices—helps you stay ahead.
SmartCharts turn market data into actionable insights, giving you a clearer edge in Binary.com trading.
Some of the standout features include:
Multiple chart types such as candlestick, bar, and line charts
Real-time price updates
Various technical indicators to signal market momentum and support/resistance levels
User-friendly tools for marking patterns and key price points
Using SmartCharts effectively means less guesswork and more confidence in your trades. This guide will walk you through how these charts work, highlight their key tools, and share tips to make the most of them on Binary.com. It’s designed for traders at every level, whether you are new to the platform or looking to sharpen your market analysis skills.
SmartCharts on Binary.com serve as an essential tool for Kenyan traders aiming to understand market movements clearly and make more precise trading decisions. These charts are designed to be user-friendly while offering deep analytical capabilities, which can help even those with limited technical knowledge access useful market information. For instance, a trader following forex pairs like USD/KES on SmartCharts can spot trends early enough to decide when to buy or sell, potentially increasing gains and minimising losses.
SmartCharts are interactive, online charts that display real-time price movements and historical data for various financial assets. They integrate advanced features such as customisable views, multiple chart types (including candlestick and line charts), and a wide array of technical indicators. This combination allows traders to analyse short- and long-term price trends efficiently. Unlike static charts on ordinary websites, SmartCharts update instantly and let users add overlays like moving averages or RSI (Relative Strength Index) for a sharper insight into market behaviour.
Kenyan traders should embrace SmartCharts because they offer a locally relevant and practical approach to trading. Since most Kenyan traders rely on platforms like Binary.com for binary options or forex trading, having accurate and timely data is key. SmartCharts streamline access to live updates, which is crucial given the sometimes volatile nature of markets influenced by global events or local economic shifts.
Additionally, SmartCharts' compatibility with mobile devices means traders can monitor trends even while commuting or away from their desktops, a common scenario in Nairobi's busy life. Integration with payment options such as M-Pesa simplifies funding accounts right after spotting a promising trade signal. This quick access can reduce missed opportunities and improve overall trading efficiency. In brief, SmartCharts equip Kenyan traders with the tools to be more proactive and informed, directly supporting better trading outcomes.
Access to fast, clear, and customisable charts can make the difference between guessing and making informed trading decisions in dynamic markets such as those common in Kenya.
Understanding SmartCharts lays a strong foundation for using other advanced trading strategies explored later in this guide.
SmartCharts on Binary.com bring together essential features that help Kenyan traders make sense of market movements quickly and accurately. These features offer practical tools tailored to meet the needs of active traders who want to analyse price behaviour without switching between multiple platforms. Focusing on multiple chart types, useful technical indicators, drawing tools, real-time data, and alert systems, SmartCharts provide a comprehensive setup for both beginners and advanced traders.
SmartCharts support various chart types including candlestick, line, bar, and area charts. Candlestick charts are particularly popular among Kenyan traders because they give clear visual cues on price action, showing open, close, highs, and lows within chosen timeframes. For example, you can switch to a 15-minute candlestick chart when trading forex pairs like USD/KES to spot short-term trends.
Customisation goes beyond chart types. You can adjust colours, timeframes, and zoom levels to match your trading style. For instance, if you prefer trading during market hours when liquidity is high, you might set your chart to overlay relevant time bands. This flexibility ensures each trader gets a personalised view that aids decision-making, going beyond default boring layouts.
Moving averages smooth out price data to help identify trends by averaging closing prices over set days. The 50-day and 200-day moving averages are widely used by Kenyan traders to confirm if an asset is in an uptrend or downtrend. For example, if the 50-day moving average crosses above the 200-day, it may suggest a good time to buy equities listed at NSE.
The Relative Strength Index (RSI) measures momentum on a scale from 0 to 100, signalling overbought conditions above 70 and oversold below 30. Kenyan traders use RSI to time entries and exits, especially when trading forex or commodities like tea and coffee futures. An RSI near 80 might warn that the price is due for a correction, encouraging caution.

Drawing trendlines on SmartCharts allows you to connect successive lows or highs to pinpoint the trajectory of prices. For example, if you’re following the Nairobi Securities Exchange (NSE) 20 share index, sketching a rising trendline can offer insight into market momentum.
Support and resistance levels mark price points where buying or selling pressures build up, causing pauses or reversals. Identifying these levels on SmartCharts helps Kenyan traders set realistic target prices or stop losses. If the price repeatedly bounces off KSh 300 on a particular stock, that's a support level to watch.
SmartCharts deliver real-time market data, which is critical for trading in environments as volatile as Kenyan markets. Delays could mean missed opportunities or unexpected losses. For instance, when trading on local-currency pairs like KES/USD, having up-to-the-second quotes helps you react to announcements like CBK monetary policy changes.
You can also set alerts to notify you when prices reach certain levels or when indicators trigger specific signals. This feature is quite handy for busy traders juggling multiple assets, allowing them to stay on top without staring at the screen all day. For example, set an alert for when the NSE 20 index drops below a key support level, prompting timely action.
SmartCharts are more than pretty graphs — they are practical tools that give Kenyan traders an edge by combining visual clarity, technical insights, and timely information.
By mastering these key features, you can sharpen your analysis and trade smarter, whether you’re dealing with stocks, forex, or commodities on Binary.com.
SmartCharts offer Kenyan traders a solid tool to make more informed decisions based on real-time market data. When used properly, these charts can help spot market movements early, reduce guesswork, and support strategies tailored to Kenya's unique trading environment. Understanding how to set up and interpret the charts is vital to gain an edge while trading on Binary.com.
Choosing assets that are actively traded and relevant to Kenya’s market conditions is crucial. For example, Kenyan traders might focus on cross-currency pairs involving the Kenyan shilling (KES), like USD/KES or EUR/KES, or commodities like coffee and tea which are major Kenyan exports. Focusing on these assets means the data on SmartCharts is more likely to reflect true market activity, offering better insights for your trades.
Besides foreign exchange and commodities, some traders also explore stocks or indices linked to East African markets or larger global ones affecting Kenya’s economy. This diversity can help manage risk because you’re not relying on one asset class. Setting your chart to the right market ensures your analysis matches local trading realities.
Selecting the right timeframe on SmartCharts matches your trading style and goals. For instance, a day trader working on shorter-term swings might use 5-minute or 15-minute charts to catch quick price movements. This timeframe suits Kenya’s active sessions, especially during global trading overlaps.
On the other hand, swing or position traders looking for longer-term trends may prefer daily or weekly timeframes. These help smooth out noise and focus on fundamental trends, such as global commodity price shifts impacting Kenyan exports. Choosing the appropriate timeframe also helps reduce stress by aligning chart signals with your trade duration and risk appetite.
Successful use of SmartCharts depends heavily on recognising familiar price patterns and signals. Patterns such as double tops, head and shoulders, or triangles can indicate potential changes in direction. For example, spotting a bullish breakout after a triangle pattern could point to a good buying opportunity.
Kenyan traders should also pay close attention to candlestick signals like hammers or shooting stars, which provide quick visual clues about market sentiment. These tools help you anticipate moves before they show up in the price, allowing timely entries or exits.
Skilled reading of chart patterns turns raw data into actionable insight, helping traders avoid impulsive decisions especially in volatile markets like currency pairs involving the shilling.
No single indicator paints the full market picture; combining them enhances reliability. For example, pairing the Relative Strength Index (RSI) with Moving Averages can help confirm entry points. RSI might show an asset is oversold while a Moving Average crossover signals a trend change.
Using multiple indicators also helps filter out false signals typical in noisy markets. Kenyan traders might mix momentum, volume, and trend-following indicators to get a balanced sense of direction. This combined approach complements insights from chart patterns, allowing a more confident trading plan.
Ultimately, SmartCharts are a powerful resource when thoughtfully set up and read. For Kenyan traders, tailoring the charts to local market assets and preferences empowers smarter, well-timed decisions on Binary.com.
SmartCharts on Binary.com offer Kenyan traders a valuable tool for market analysis, but they come with both strengths and challenges. Knowing these helps you make smarter choices while trading and managing risks effectively.
SmartCharts are designed to work smoothly on mobile devices, which is a big plus for Kenyan traders who often rely on phones for internet access. This means you can monitor market movements and adjust your trades on the go, whether you are on a matatu or at a nyama choma joint. The interface adapts well to different screen sizes without losing crucial details, ensuring you don’t miss out on important signals even when away from a desktop.
Moreover, the platform does not require heavy data usage, which is important given the cost of mobile data in Kenya. This accessibility encourages timely responses to market changes, helping traders stay ahead.
One of the standout advantages for Kenyan traders is the ability to fund Binary.com accounts using M-Pesa, Kenya’s trusted mobile money service. This integration simplifies depositing and withdrawing funds. You can top up your trading account directly from your phone without relying on banks or cards, which can be slow and cumbersome.
For example, a trader in Kisumu can fund their account instantly via the M-Pesa app, allowing for quick entry into market opportunities. Having a seamless payment channel encourages more consistent trading activity and removes barriers for many Kenyans new to online trading.
While SmartCharts bring advanced data to your fingertips, they can appear overwhelming, especially if you are new to technical analysis. The array of graphs, indicators, and signals may confuse rather than inform, leading to poor trading decisions.
To tackle this, start with key indicators like moving averages or RSI, and learn their implications gradually. Use Binary.com’s demo accounts to practise interpreting data without risking money. Also, joining online forums or local trading groups can offer insights that turn complex charts into understandable information tailored to the Kenyan market.
"Getting comfortable with SmartCharts is a step-by-step process — patience and practice go a long way."
Kenyan traders often face challenges from sudden market swings caused by global news, local economic events, or abrupt currency movements. SmartCharts reflect this volatility clearly, but it can be hard to know when to act or avoid false signals.
Managing this involves combining chart insights with broader market news. Setting custom alerts within SmartCharts helps you stay aware of key price levels without watching the screen constantly. Additionally, applying risk management strategies like stop-loss orders, or limiting trade sizes based on chart signals, guards your capital during turbulent periods.
In short, while SmartCharts provide valuable data, adapting their use to Kenya’s dynamic trading environment ensures better decision-making and more sustainable results.
Using SmartCharts effectively can make a real difference in how Kenyan traders read the markets on Binary.com. These tips and best practices help you sharpen your skills, avoid common mistakes, and manage risks better.
Practising with SmartCharts regularly is the way to build confidence and skill. Like a footballer who trains daily to perfect dribbling, you need consistent exposure to different chart types, indicators, and tools. It’s not enough to just know what the Moving Average is; you need to observe how it reacts to Kenyan market events, such as currency fluctuations or political announcements. Keep a trading journal to note what works and what doesn’t, which can become a personalised guide over time. Also, stay updated with market news from sources like Business Daily or The Standard – understanding local economic trends helps in interpreting the charts better.
Demo accounts on Binary.com let you practise trading without risking real money. This is especially helpful in Kenya, where many traders are still learning the ropes. Use the demo environment to test your SmartCharts strategies, such as combining the RSI indicator with trendlines to spot entry and exit points. Make mistakes here, not with your actual funds. It’s advisable to simulate trades based on Kenyan market hours and assets you intend to trade on live accounts. When you’re confident your strategy holds steady in the demo, and you’ve reduced emotional decisions, then you can transition to live trading gradually.
SmartCharts provide signals that can help manage risk if you pay attention correctly. For example, spotting support and resistance levels can guide you on when to cut losses or take profits. Kenyan traders should set clear stop-loss levels based on these insights to avoid losing more than planned. Remember, markets can be volatile, especially during Kenya’s election seasons or after CBK monetary policy releases. Use SmartChart alerts to remind you when prices are nearing key levels. Combining this with sound money management, such as risking only a small percentage of your trading capital on each trade, will protect your balance and keep you in the game longer.
Consistent study, practising in a risk-free demo environment, and using SmartChart signals wisely are the foundation for successful trading on Binary.com. Kenyan traders who integrate these habits tend to perform better and avoid common pitfalls.
In short, your trading journey with SmartCharts isn’t a one-time thing. It’s about adapting, learning, and managing your trades smartly based on clear signals and local context.
Explore how Kenyan traders can safely navigate Binary.com with insights on account types, trading options, platform features, and security measures 📈🇰🇪

Explore Binary Bot Deriv 🤖, a handy tool for automating binary options trading 📈. Learn setup, strategies, risks, and legal tips relevant to Kenya 🇰🇪 traders.

📈 Explore how Deriv TradingView gives Kenyan traders clear market analysis and trading tools. Learn to trade smartly, manage risks, and improve your results today!
Explore Quotex broker’s platform tailored for Kenyan traders 📈. Learn about asset types, account options, fees, regulation, and smart risk strategies here.
Based on 8 reviews